Open Access
Fig. C.2
Download original image
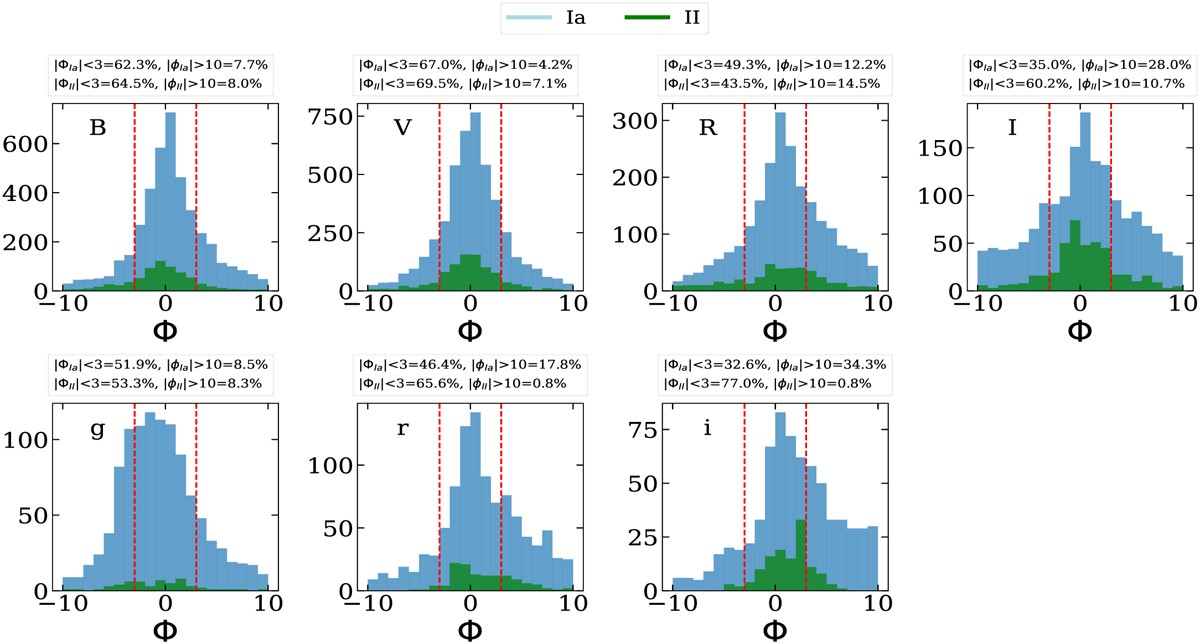
Relative photometric residuals Φ for each of the BVRIgri filters. This residuals are weighted by the error in the photometry. The red dotted line denotes the zones where |Φ| < 3.0. The legend also includes the fraction of relative residuals that fall outside the range shown in the histogram (|Φ| > 10.0).
Current usage metrics show cumulative count of Article Views (full-text article views including HTML views, PDF and ePub downloads, according to the available data) and Abstracts Views on Vision4Press platform.
Data correspond to usage on the plateform after 2015. The current usage metrics is available 48-96 hours after online publication and is updated daily on week days.
Initial download of the metrics may take a while.