Fig. 4
Download original image
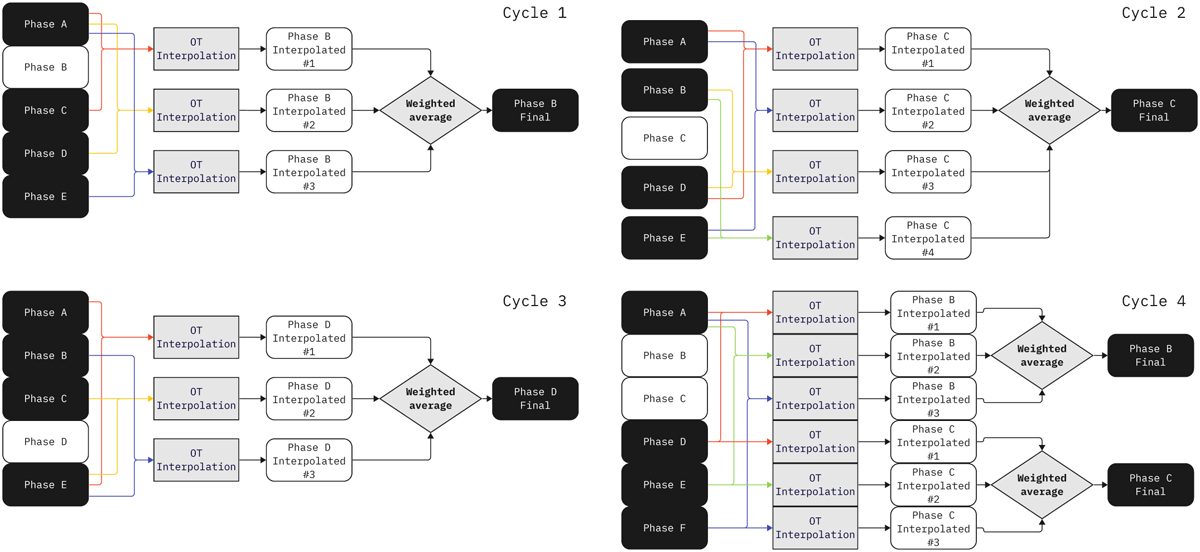
Averaging scheme for the second test: Black boxes represent the spectra used for interpolation, and white boxes indicate the target phase for interpolation. Colored lines link pairs of spectra, which are used to create the interpolated spectrum at the position marked by the white box. To compute the final spectrum at a given phase, a weighted average is calculated across all interpolated spectra.
Current usage metrics show cumulative count of Article Views (full-text article views including HTML views, PDF and ePub downloads, according to the available data) and Abstracts Views on Vision4Press platform.
Data correspond to usage on the plateform after 2015. The current usage metrics is available 48-96 hours after online publication and is updated daily on week days.
Initial download of the metrics may take a while.