Open Access
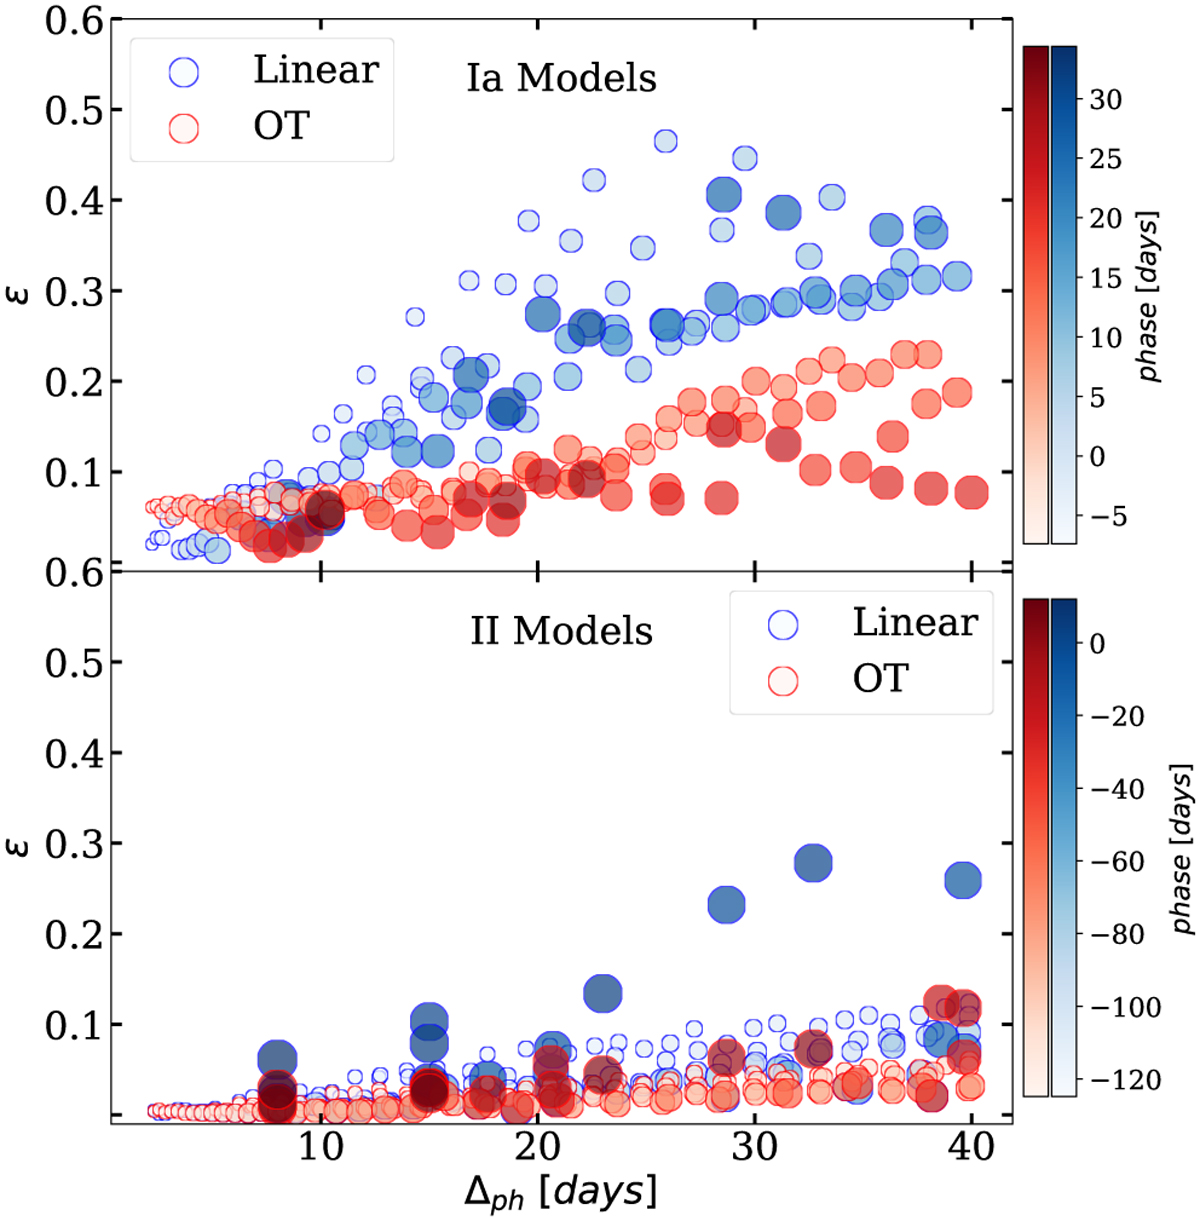
Fig. 3
Download original image
Relative spectral residuals ϵ as a function of ∆ph. Blue circles correspond to the linear interpolation and the red ones to the OT. The size and darkness of the circles increase with the phase of the interpolated spectrum.
Current usage metrics show cumulative count of Article Views (full-text article views including HTML views, PDF and ePub downloads, according to the available data) and Abstracts Views on Vision4Press platform.
Data correspond to usage on the plateform after 2015. The current usage metrics is available 48-96 hours after online publication and is updated daily on week days.
Initial download of the metrics may take a while.