Open Access
Fig. 2
Download original image
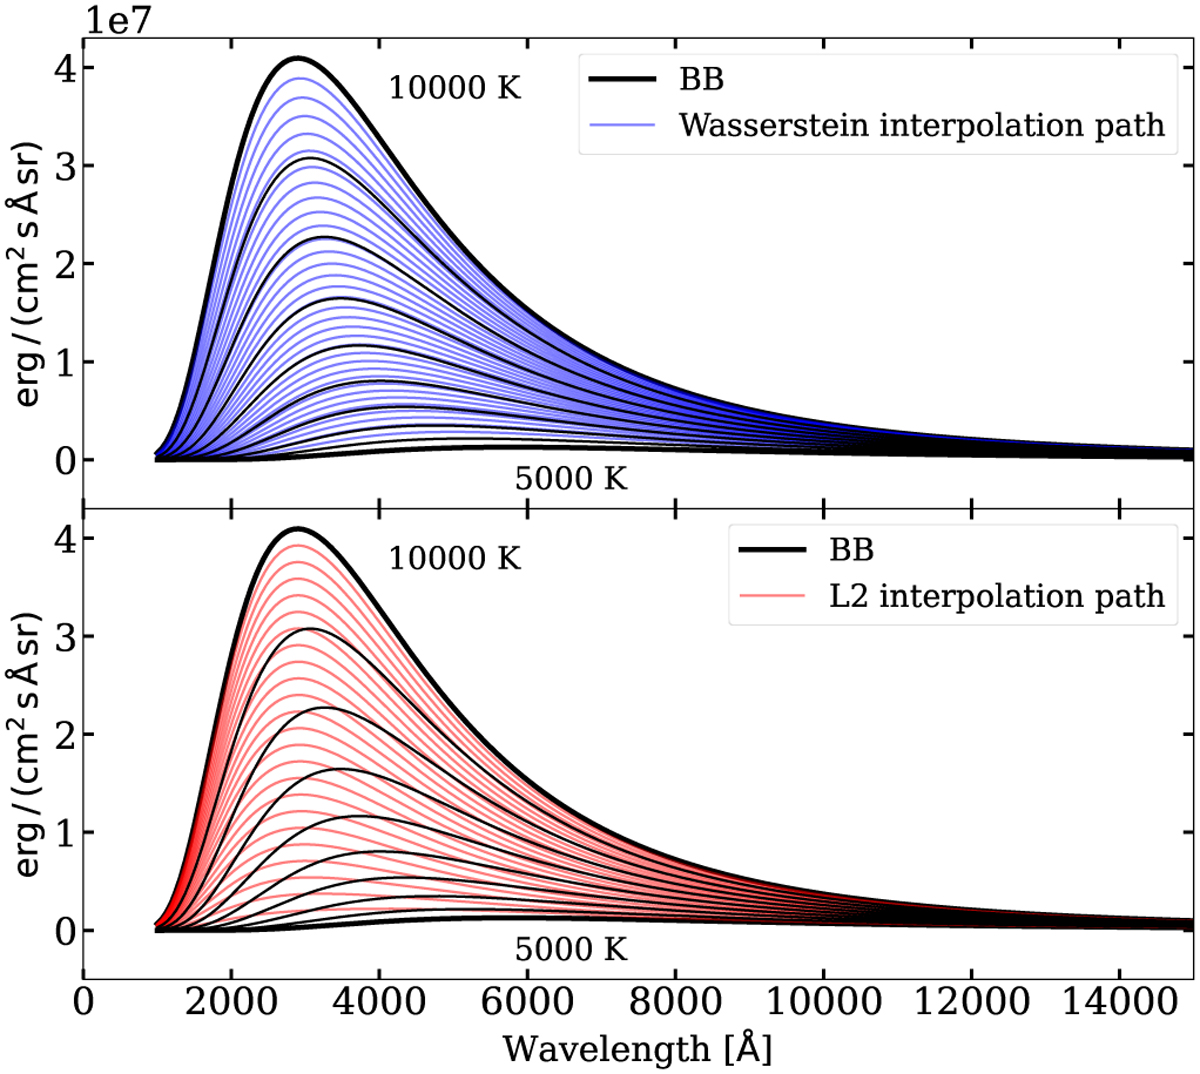
Examples of black body interpolations using Wasserstein and L2 barycenters. In both panels, black lines show black body radiation at different temperatures. In the top panel, OT interpolations are represented in blue, while in the bottom panel, linear interpolations are presented in red.
Current usage metrics show cumulative count of Article Views (full-text article views including HTML views, PDF and ePub downloads, according to the available data) and Abstracts Views on Vision4Press platform.
Data correspond to usage on the plateform after 2015. The current usage metrics is available 48-96 hours after online publication and is updated daily on week days.
Initial download of the metrics may take a while.