Fig. B.1.
Download original image
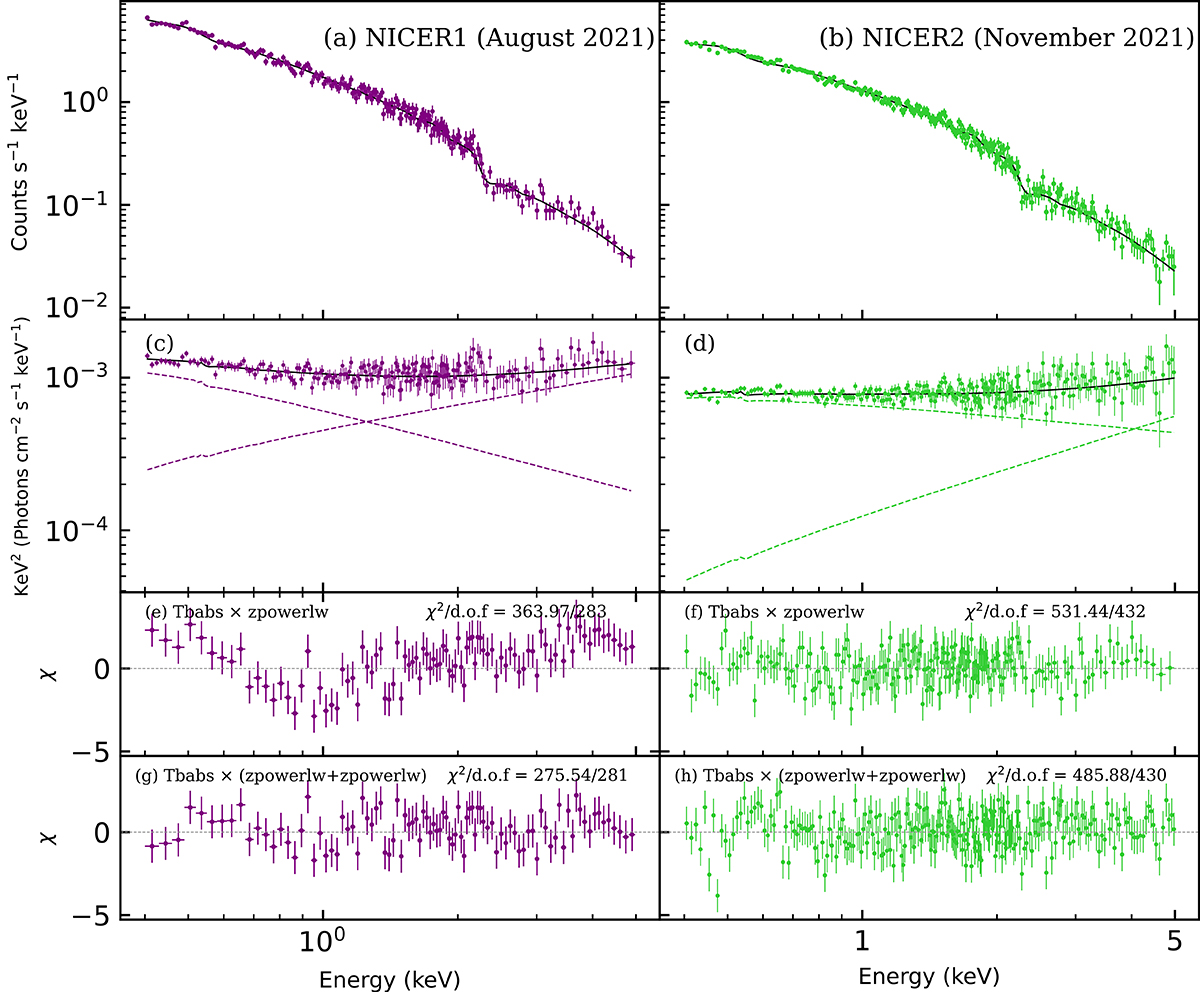
NICER X-ray spectra of J0408−38 and model fits. The left column shows the data and models for the NICER1 observation in August 2021, taken during the flaring of the event. The right column shows the data and models for the NICER2 observation in November 2021, during the fading of the flare. Panels (a) and (b) show the counts spectra, with the best-fitting double power-law model plotted as a solid line. Panels (c) and (d) show the "unfolded" best-fitting double power-law models and data; the individual power-law components are plotted with dashed lines, and the summed model is shown as a solid line. Panels (e) and (f) show residuals to a simple power-law fit; the fits are poor and suggest the presence of additional components in the spectra. Panels (g) and (h) show residuals from the double power-law model; the fits are good, and in qualitative agreement with fits to the XMM-Newton EPIC spectra.
Current usage metrics show cumulative count of Article Views (full-text article views including HTML views, PDF and ePub downloads, according to the available data) and Abstracts Views on Vision4Press platform.
Data correspond to usage on the plateform after 2015. The current usage metrics is available 48-96 hours after online publication and is updated daily on week days.
Initial download of the metrics may take a while.