Open Access
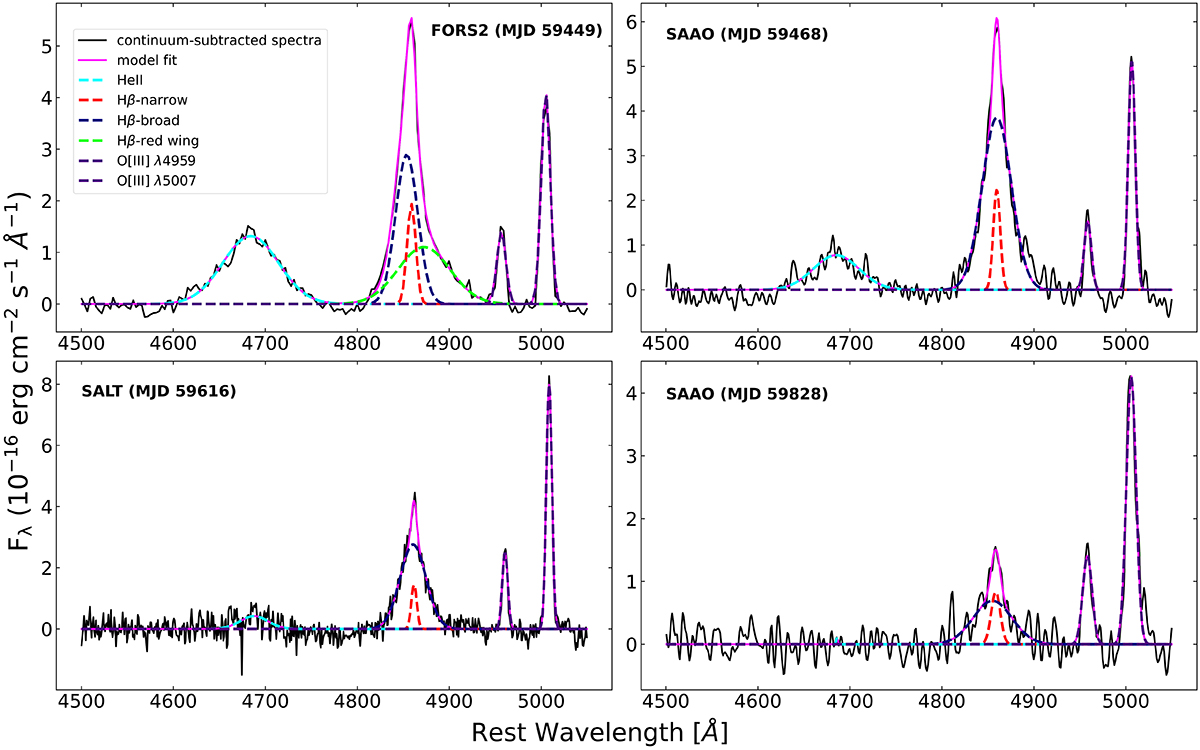
Fig. 5.
Download original image
The fit residuals after the subtraction of the AGN continuum and host galaxy contribution are represented by the continuous black line. Here, we model the He IIλ4686, Hβλ4861, and [O III] λλ5007,4959 emission profiles. The magenta line marks the fit of the total spectrum including all emission components.
Current usage metrics show cumulative count of Article Views (full-text article views including HTML views, PDF and ePub downloads, according to the available data) and Abstracts Views on Vision4Press platform.
Data correspond to usage on the plateform after 2015. The current usage metrics is available 48-96 hours after online publication and is updated daily on week days.
Initial download of the metrics may take a while.