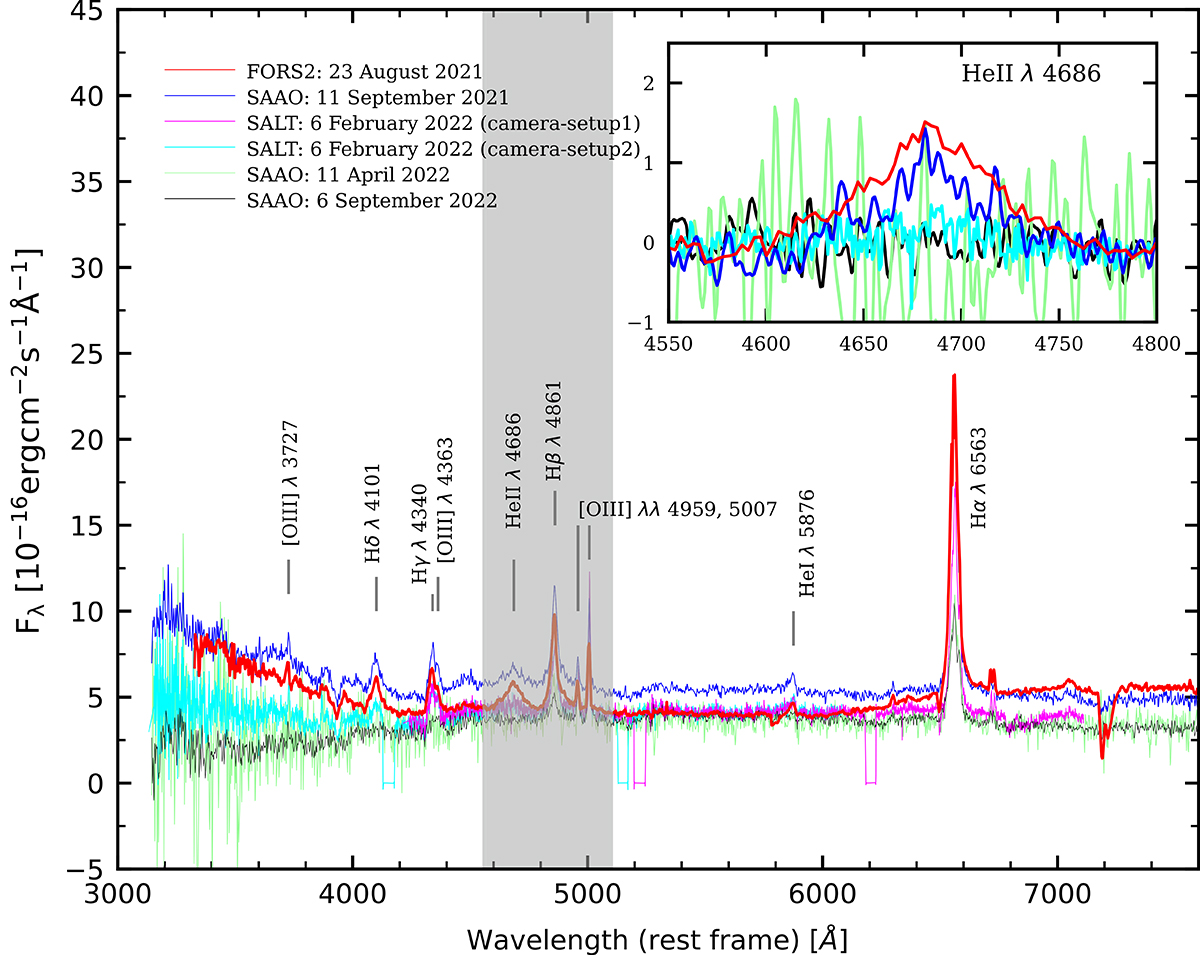
Fig. 4.
Download original image
Optical spectra of J0408−38 taken with VLT, SAAO 1.8m, and SALT. The flux has been re-scaled for all the spectra using the [O III] λ5007 emission line. Prominent emission lines are marked. In the inset figure, we show the window range of 4550–4800 Å; spectra are scaled to have matching continuum levels. The He IIλ4686 emission line fades dramatically over the course of the observations.
Current usage metrics show cumulative count of Article Views (full-text article views including HTML views, PDF and ePub downloads, according to the available data) and Abstracts Views on Vision4Press platform.
Data correspond to usage on the plateform after 2015. The current usage metrics is available 48-96 hours after online publication and is updated daily on week days.
Initial download of the metrics may take a while.