Fig. 8
Download original image
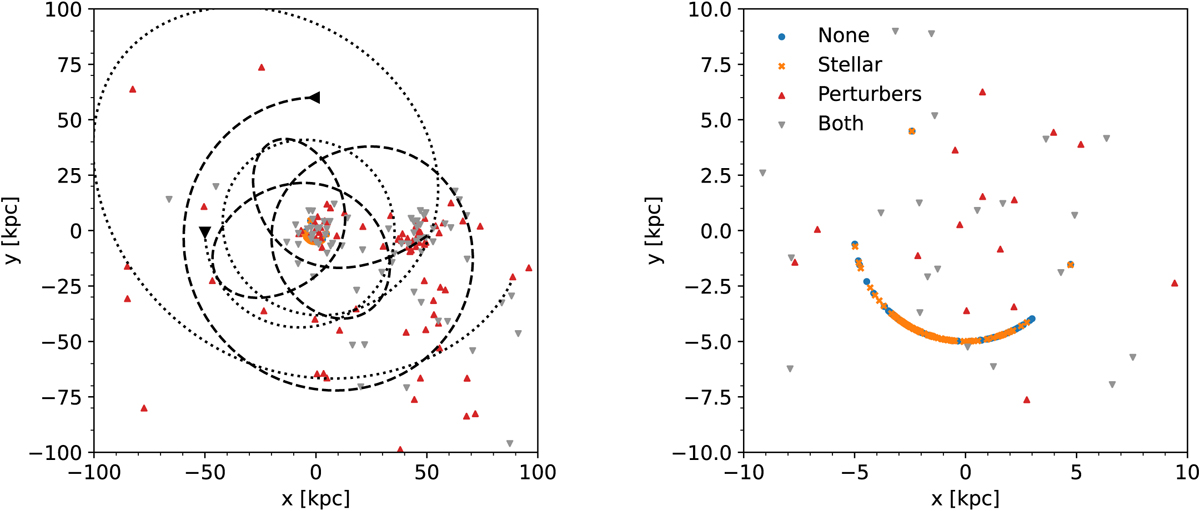
Maps of the combined simulation projected on the galactic plane. The left panel shows a wide view, while the right panel is zoomed in on the centre. The dashed and dotted black lines show the trajectories of the two perturbers. Points show the positions at 5 Gyr of the cluster stars, where the colour indicates the model set-up (red and grey are with perturbers; orange and grey are with stellar evolution).
Current usage metrics show cumulative count of Article Views (full-text article views including HTML views, PDF and ePub downloads, according to the available data) and Abstracts Views on Vision4Press platform.
Data correspond to usage on the plateform after 2015. The current usage metrics is available 48-96 hours after online publication and is updated daily on week days.
Initial download of the metrics may take a while.