Fig. 2
Download original image
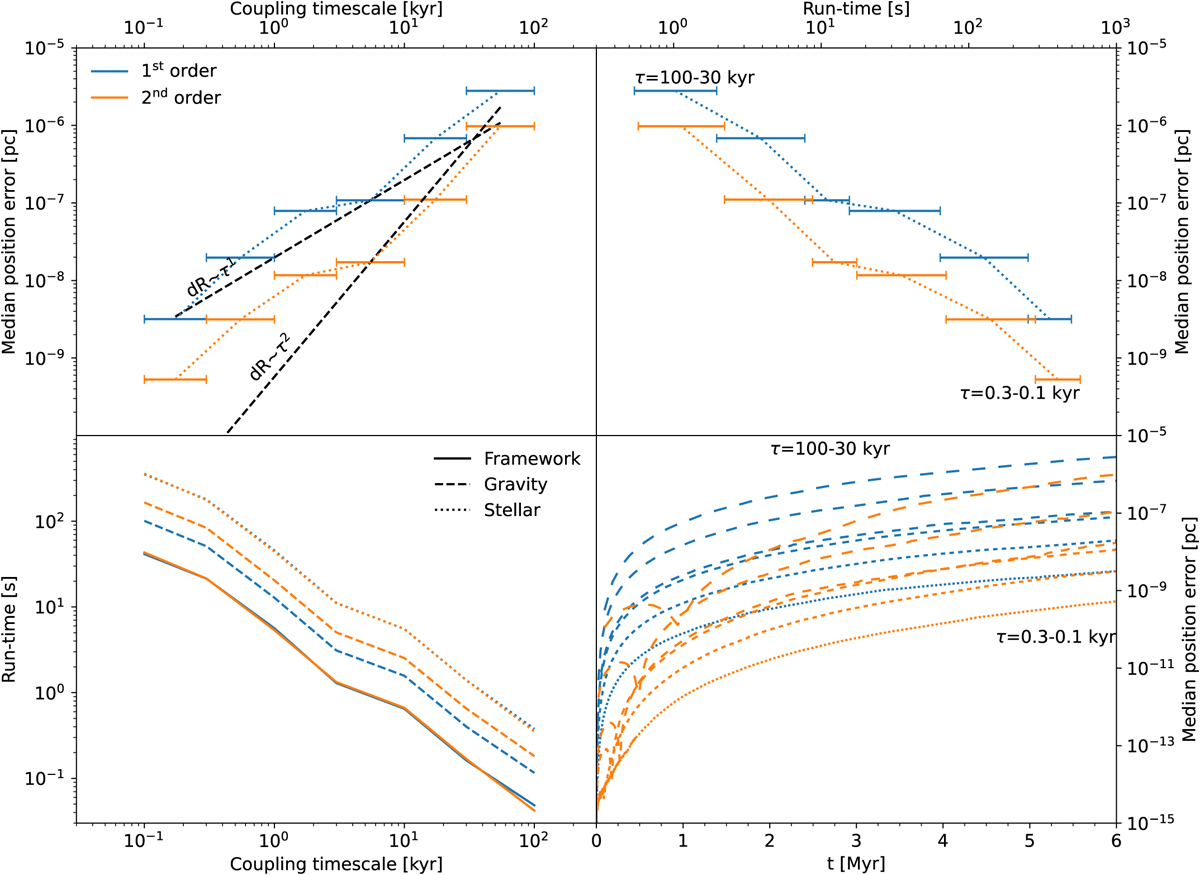
Convergence and performance of a gravitational dynamics model and a stellar evolution one, coupled at a constant timescale. The top panels and the bottom left panel show three views of the median position error, coupling timescale, and wall-clock run-time as functions of each other. The bottom right panel shows the time evolution of the median position error in all runs. The dashed black lines in the top left plot show linear and quadratic scalings of the error with the timescale.
Current usage metrics show cumulative count of Article Views (full-text article views including HTML views, PDF and ePub downloads, according to the available data) and Abstracts Views on Vision4Press platform.
Data correspond to usage on the plateform after 2015. The current usage metrics is available 48-96 hours after online publication and is updated daily on week days.
Initial download of the metrics may take a while.