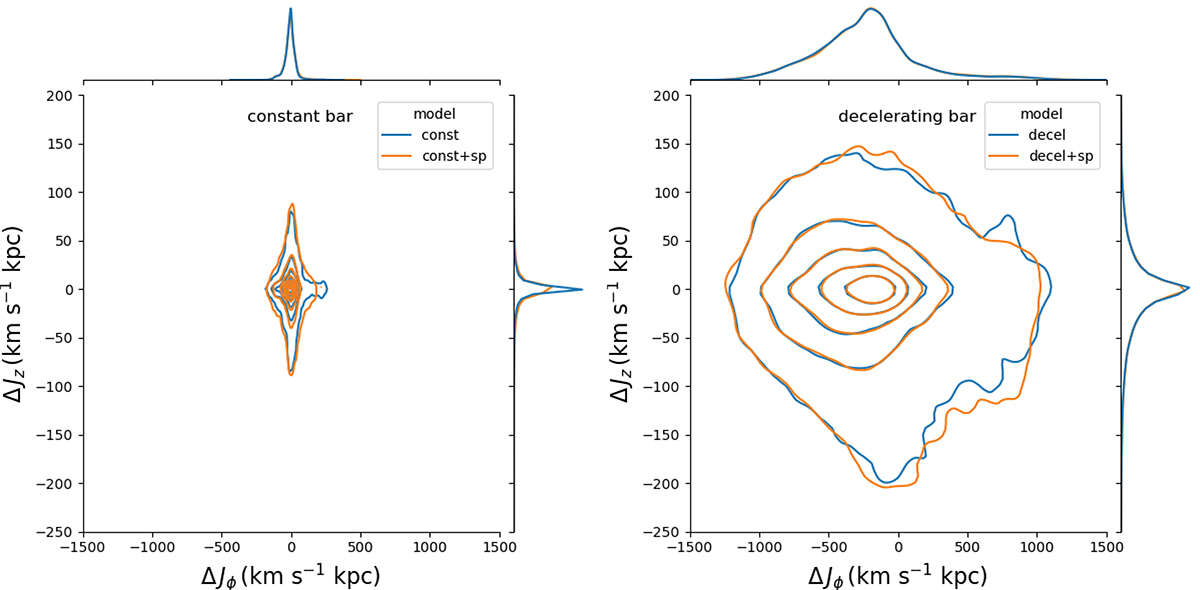
Fig. 3.
Download original image
Density contour plot of the action changes with respect to the initial state for all sampled particles. The left and right panels show the case of the constant bar models and the decelerating bar models, respectively. In both panels, the orange contours represent models with spiral arms, and the blue contours show models without spiral arms. Spiral arms only have a small impact on the orbital properties of the particles. The sampled stars under the decelerating bar have a much wider distribution in ΔJϕ and ΔJz compared to those with the constant bar. The majority of the particles lose rotation (ΔJϕ < 0) and only a small fraction of them (19%) have gained rotation from the bar during the last 6 Gyr.
Current usage metrics show cumulative count of Article Views (full-text article views including HTML views, PDF and ePub downloads, according to the available data) and Abstracts Views on Vision4Press platform.
Data correspond to usage on the plateform after 2015. The current usage metrics is available 48-96 hours after online publication and is updated daily on week days.
Initial download of the metrics may take a while.