Fig. 2.
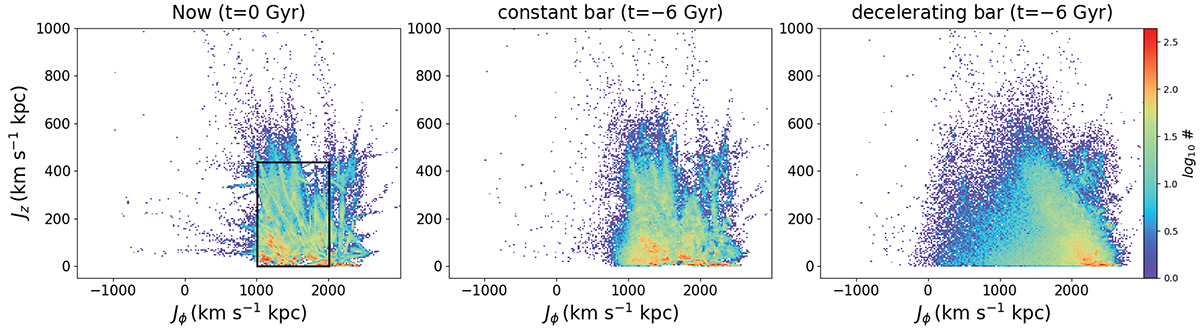
Download original image
Density plot of all sampled particles in the action space (Jϕ, Jz). Left: Original sample of stars currently in the selection box (black rectangle): 1005 km s−1kpc ≤ Jϕ ≤ 2010 km s−1kpc and 0.175 km s−1kpc ≤ Jz ≤ 437.5 km s−1kpc. Middle: Sampled particles 6 Gyr ago in model (ii) of a constant bar with spiral arms. They remain similar to their initial distribution in the left panel. Right: Particles in model (iv) of a decelerating bar with spiral arms. They have a more extended distribution Jϕ 6 Gyr ago in this model. Some low-Jϕ particles (Jϕ ≲ 1000 km s−1kpc) have gained rotation from the bar, but represent only a small fraction of the entire sample.
Current usage metrics show cumulative count of Article Views (full-text article views including HTML views, PDF and ePub downloads, according to the available data) and Abstracts Views on Vision4Press platform.
Data correspond to usage on the plateform after 2015. The current usage metrics is available 48-96 hours after online publication and is updated daily on week days.
Initial download of the metrics may take a while.