Fig. 9
Download original image
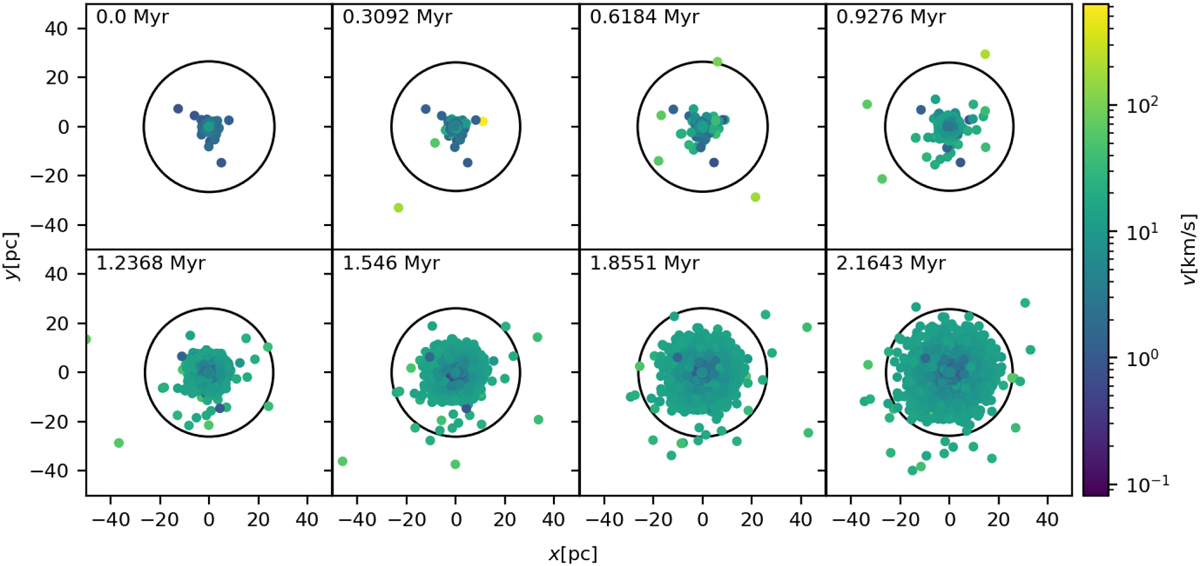
Snapshots of the SC (main model; Table 1) in the x-y plane (the Galactic centre being in negative x-direction) for the first eight timesteps to show the expansion due to gas expulsion. The tidal radius is shown as a black circle, and the stars are colour-coded according to the absolute value of their velocities relative to the SC’s centre of mass.
Current usage metrics show cumulative count of Article Views (full-text article views including HTML views, PDF and ePub downloads, according to the available data) and Abstracts Views on Vision4Press platform.
Data correspond to usage on the plateform after 2015. The current usage metrics is available 48-96 hours after online publication and is updated daily on week days.
Initial download of the metrics may take a while.