Fig. 5
Download original image
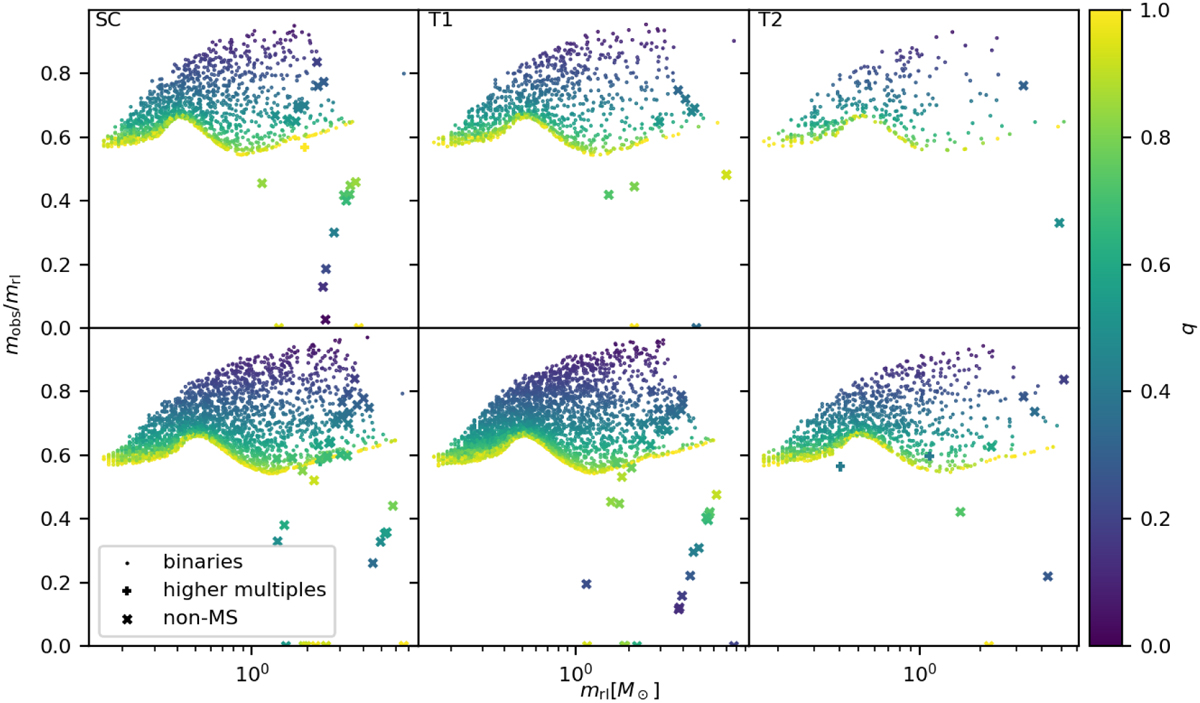
Masses of multiple star systems in the SC (left), T1 (centre), and T2 (right) of the main model (top) and the five M2 models (bottom) as seen by an observer over the real total mass of the systems at the end of the simulation (T = 300 Myr). Binaries composed of only main-sequence stars are shown as dots, while multiple systems containing non-main-sequence stars are displayed as crosses. The colour denotes the mass ratio of the system.
Current usage metrics show cumulative count of Article Views (full-text article views including HTML views, PDF and ePub downloads, according to the available data) and Abstracts Views on Vision4Press platform.
Data correspond to usage on the plateform after 2015. The current usage metrics is available 48-96 hours after online publication and is updated daily on week days.
Initial download of the metrics may take a while.