Fig. 15
Download original image
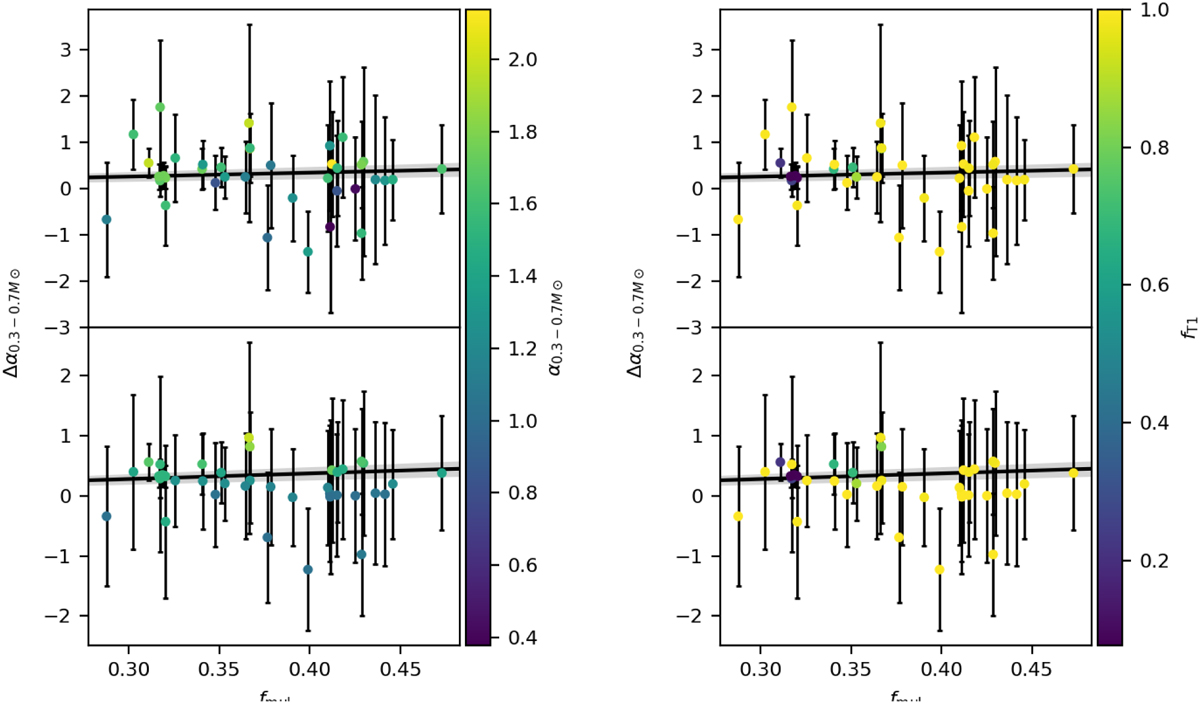
Difference between the observed and real α between 0.3 and 0.7 M⊙ depending on the multiplicity for the last timestep of the main model (top) and the low-mass models (bottom). The data is colour-coded according to the real α (left) and the portion of T1 stars (right). Populations with a larger fraction of unresolved multiple systems thus have a larger Δα and therefore a smaller observed α, i.e. the observer deduces a flatter MF. The grey area shows the uncertainty in the slope. Note that for the five low-mass models, all data points are plotted and fitted together.
Current usage metrics show cumulative count of Article Views (full-text article views including HTML views, PDF and ePub downloads, according to the available data) and Abstracts Views on Vision4Press platform.
Data correspond to usage on the plateform after 2015. The current usage metrics is available 48-96 hours after online publication and is updated daily on week days.
Initial download of the metrics may take a while.