Fig. 14
Download original image
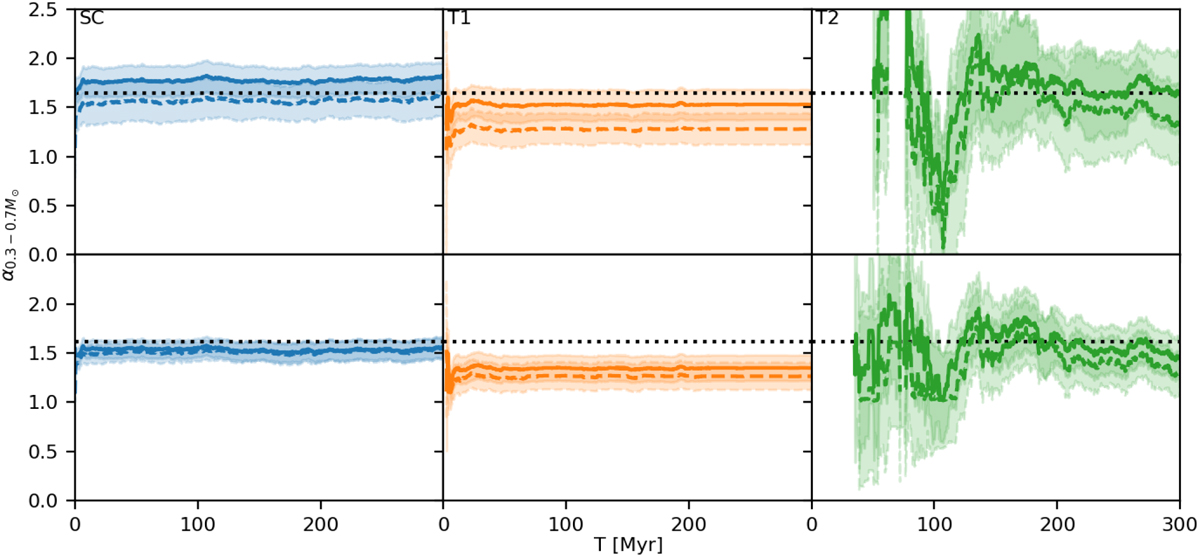
MF slope obtained using the fitting approach (Eq. (24), top) and the MLE (bottom) between 0.3 and 0.7 M⊙ over time for the main model. Both the MFs as seen by an observer who cannot resolve the binaries (dashed) and the actual real MFs (solid) of the resolved SC, T1, and T2 are shown. The coloured areas show the 1σ confidence span. The canonical value of 1.65 is shown as a dotted black line.
Current usage metrics show cumulative count of Article Views (full-text article views including HTML views, PDF and ePub downloads, according to the available data) and Abstracts Views on Vision4Press platform.
Data correspond to usage on the plateform after 2015. The current usage metrics is available 48-96 hours after online publication and is updated daily on week days.
Initial download of the metrics may take a while.