Fig. 11
Download original image
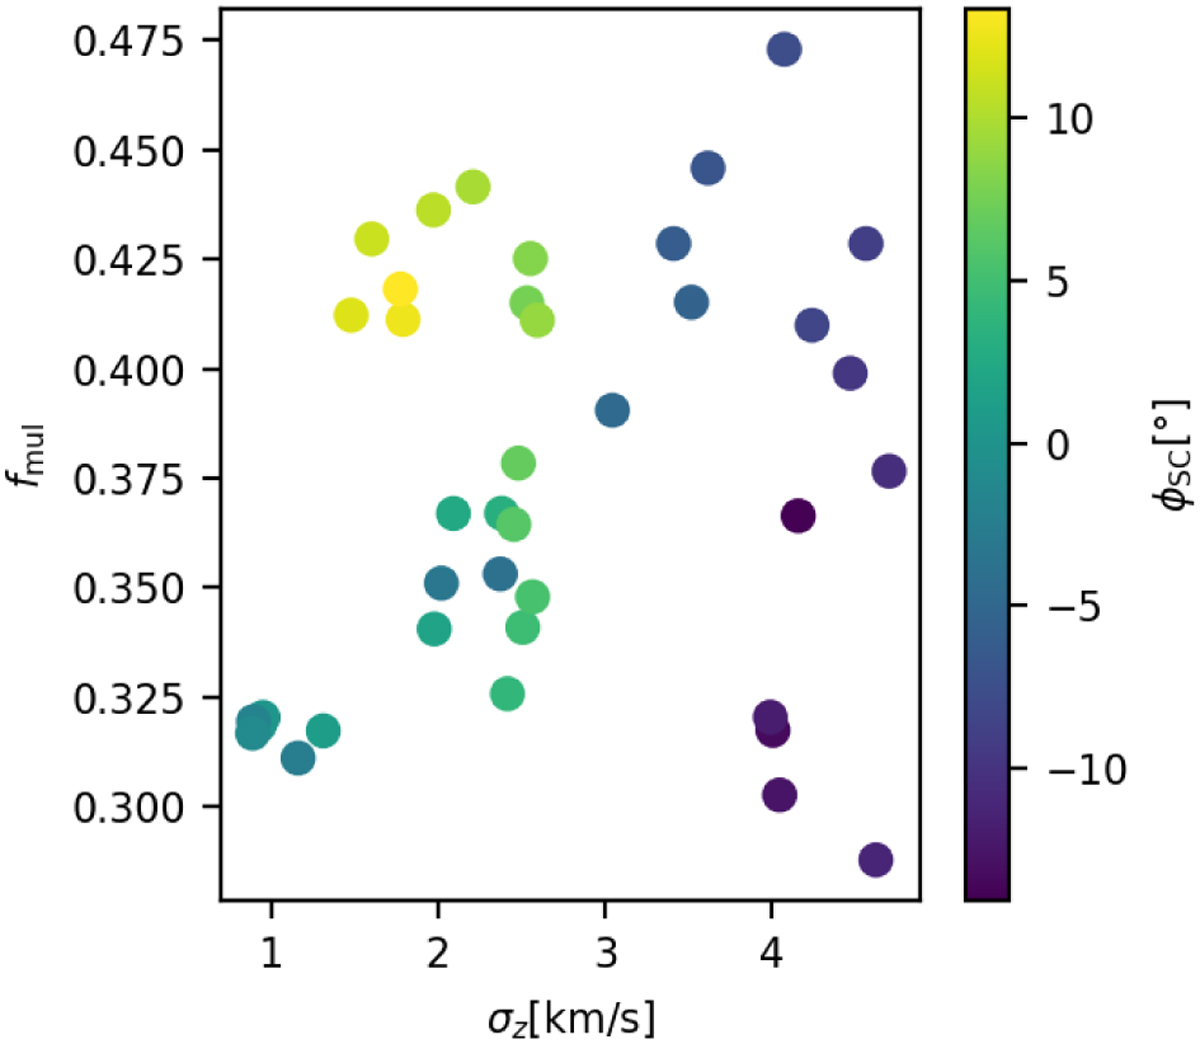
Fraction of stars in multiple systems over the velocity dispersion of stars in the z-direction at the end of the simulation (T = 300 Myr) for the main model. The points are colour-coded according to the angular distance in degrees of the cylinder from the SC with respect to the Galactic centre. Positive values of ϕSC indicate the stellar populations in the leading T1 and T2 tails, while ϕSC < 0 indicate the trailing tail ones.
Current usage metrics show cumulative count of Article Views (full-text article views including HTML views, PDF and ePub downloads, according to the available data) and Abstracts Views on Vision4Press platform.
Data correspond to usage on the plateform after 2015. The current usage metrics is available 48-96 hours after online publication and is updated daily on week days.
Initial download of the metrics may take a while.