Fig. C.1
Download original image
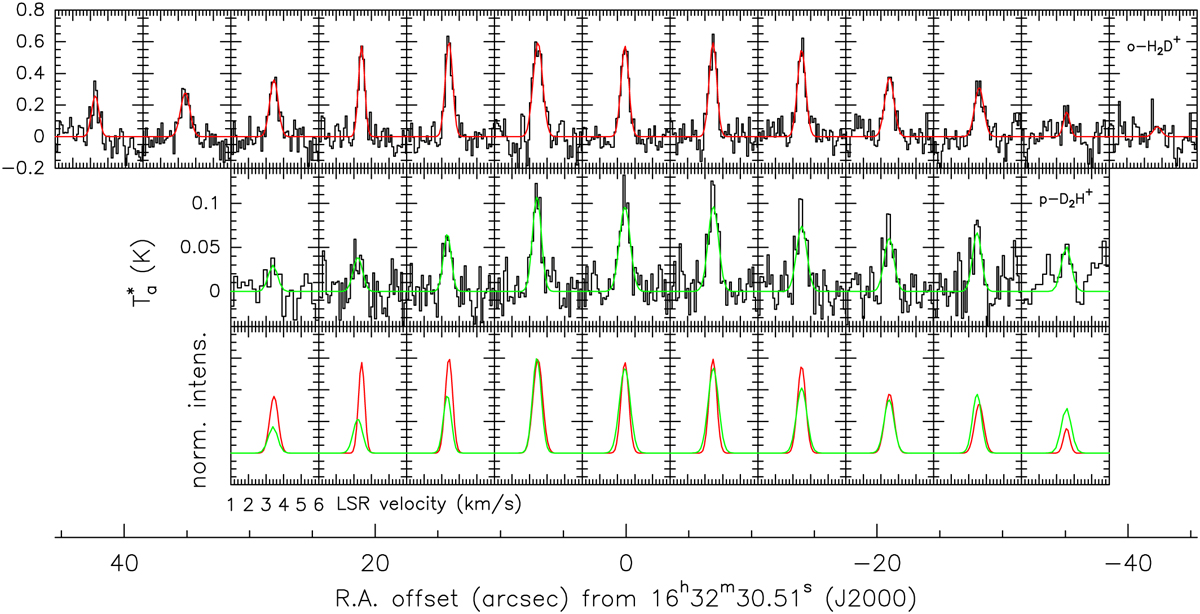
JCMT spectra of ortho-H2D+ JKK′:110−111 (top row, velocity axis from 1 to 6 km s−1), and APEX spectra of para-D2H+ JKK′:110−101 (middle row, velocity axis from 1 to 6 km s−1) across the cloud (the position of the cut is indicated in Fig. 2). Gaussian fits are overlaid in red and green, respectively. The same Gaussian fits with same colour code are reproduced in the bottom row, after normalization to the peak temperature for the +7″ spectrum, for a better comparison of the ratio variation and linewidth differences between the two isotopologues.
Current usage metrics show cumulative count of Article Views (full-text article views including HTML views, PDF and ePub downloads, according to the available data) and Abstracts Views on Vision4Press platform.
Data correspond to usage on the plateform after 2015. The current usage metrics is available 48-96 hours after online publication and is updated daily on week days.
Initial download of the metrics may take a while.