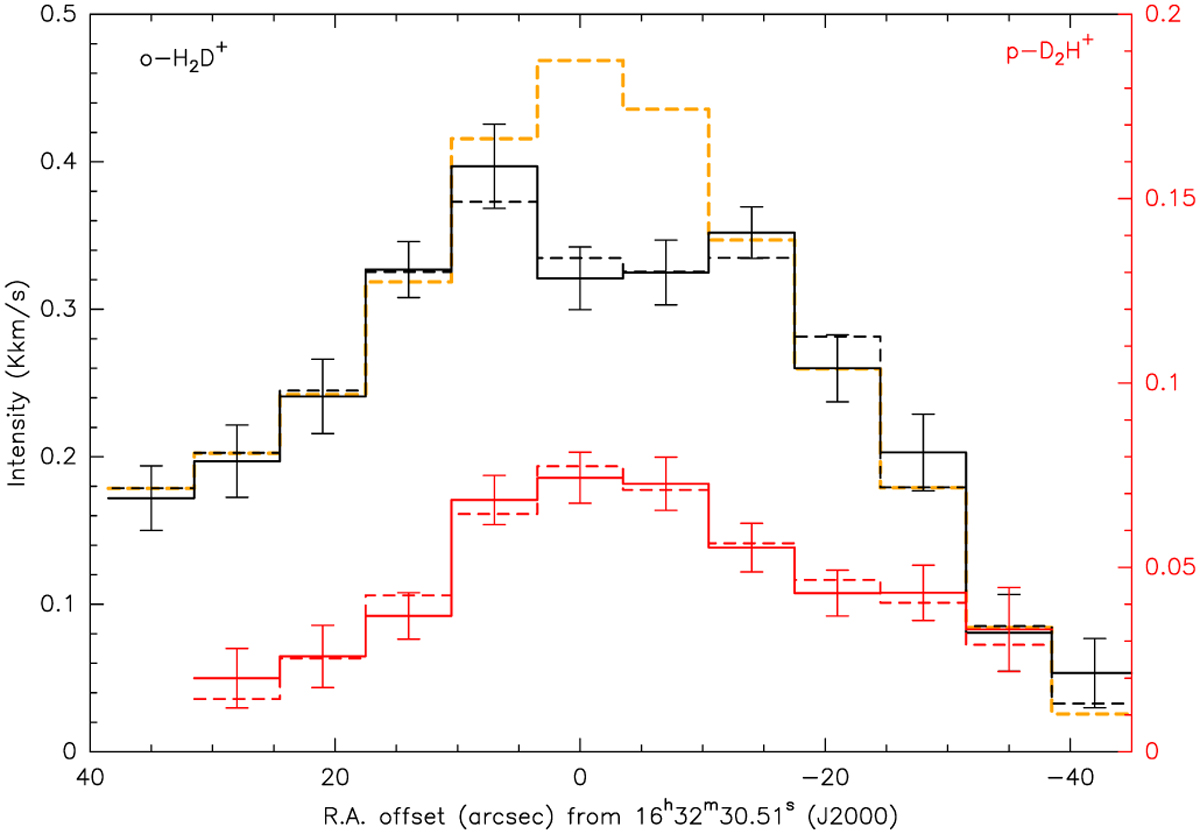
Fig. 5
Download original image
Observed intensities along the horizontal cut (solid lines with error bars, corresponding to the spectra from Fig. 3) and corresponding model intensities (dashed lines). For ortho-H2D+ we present an additional model (orange dashed line) for which the abundance is kept constant across the core. Para-D2H+ observations and model (in red) have their own intensity axis (also in red) on the right side of the plot.
Current usage metrics show cumulative count of Article Views (full-text article views including HTML views, PDF and ePub downloads, according to the available data) and Abstracts Views on Vision4Press platform.
Data correspond to usage on the plateform after 2015. The current usage metrics is available 48-96 hours after online publication and is updated daily on week days.
Initial download of the metrics may take a while.