Fig. 4
Download original image
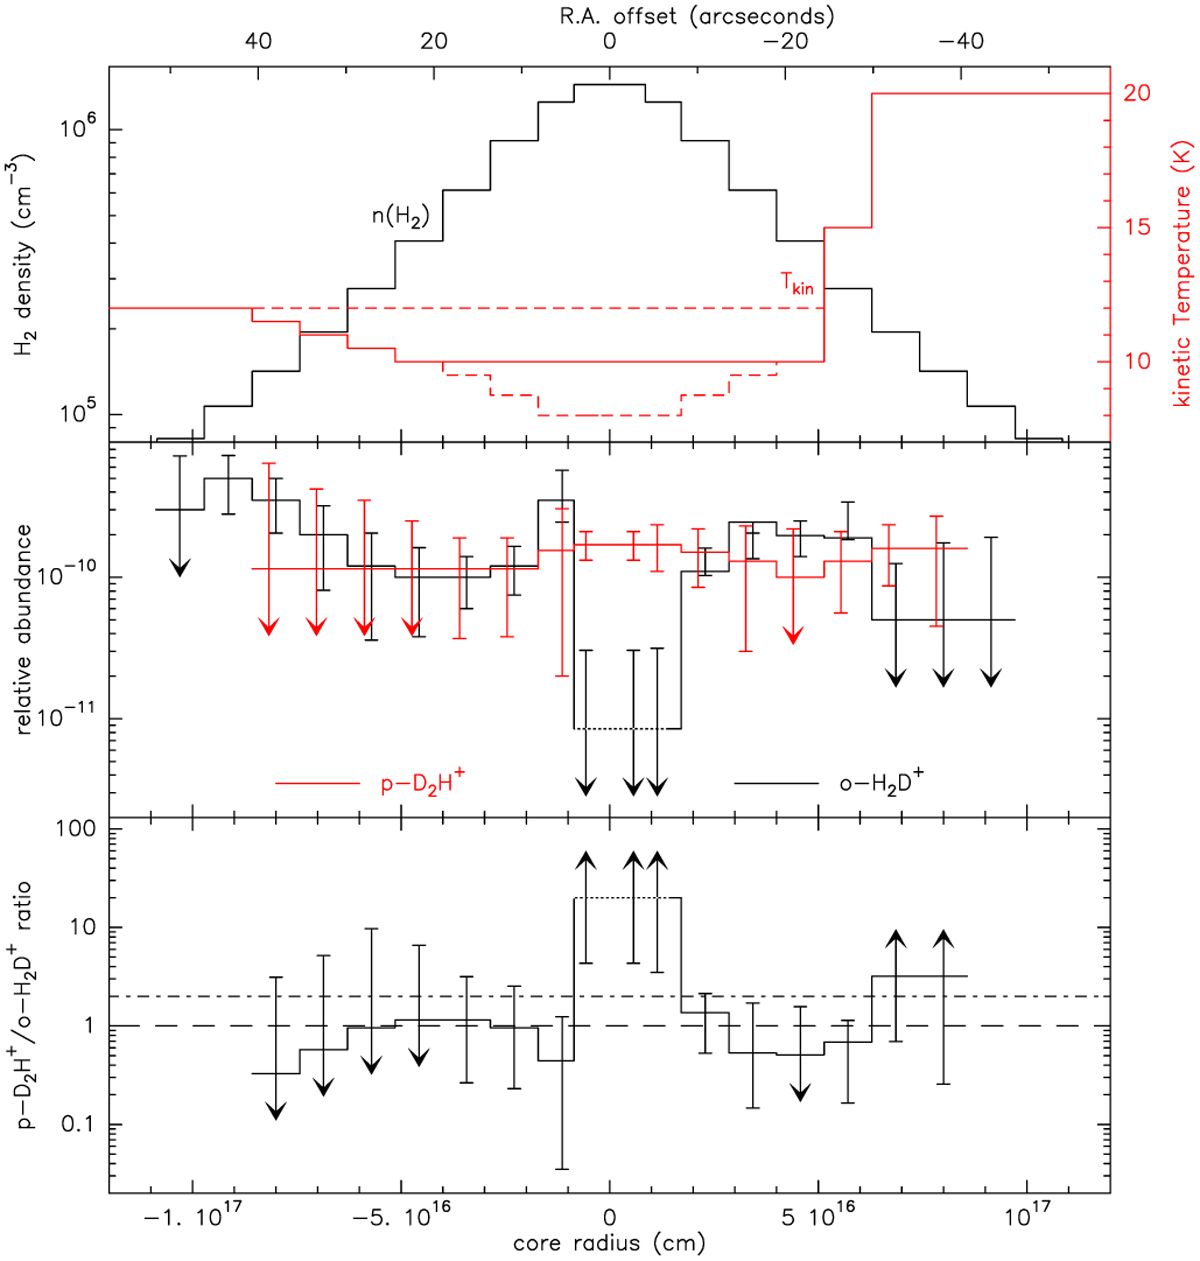
Pseudo-1D model profiles of the core. Upper box: n(H2) Plummer-like profile in black. In red, temperature profile treated separately for the east (left) and the west (right) parts of the core, with three different minimum temperatures (10 K in plain line, 8 and 12 K in dashed lines). Middle box: ortho-H2D+ (black) and para-D2H+ (red) abundance profiles relative to H2 and computed separately for each side for the 10 K model, error bars are 1σ deviation from best model. Arrows mark upper limits. In particular, for ortho-H2D+ in the centre of the core, the dotted line represents the abundance to stay just below 1σ difference with the observations, and the upper error bar represents a difference of 2σ with the observations. Lower box: para-D2H+/ortho-H2D+ ratio for the 10 K model. Error bars are computed by taking the opposite error bars of both species when available, otherwise lower or upper limits are indicated by arrows. The long dashed and dash-dotted lines mark a ratio of 1 and 2, respectively, 2 being the upper limit of the models of Bovino et al. (2021) at 10 K.
Current usage metrics show cumulative count of Article Views (full-text article views including HTML views, PDF and ePub downloads, according to the available data) and Abstracts Views on Vision4Press platform.
Data correspond to usage on the plateform after 2015. The current usage metrics is available 48-96 hours after online publication and is updated daily on week days.
Initial download of the metrics may take a while.