Fig. 2
Download original image
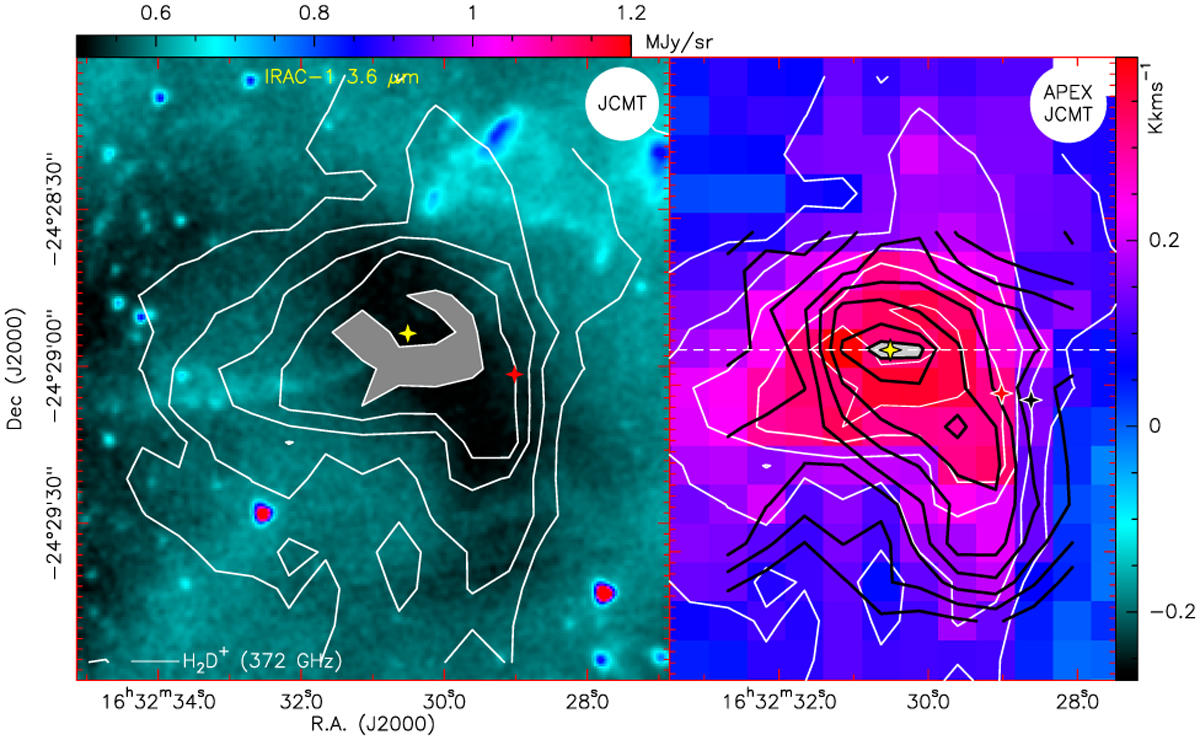
Trihydrogen isotopologue maps with IRAC-1 image. Left: IRAC-1 image at 3.6 μm. The white contours trace ortho-H2D+. The filled grey contour marks the strongest emission (contours from 0.10–0.34 by 0.06 [=2.6σ] K km s−1). Right: para-D2H+ and ortho-H2D+ maps. Same map of para-D2H+ (black contours) as in Fig. 1, but superimposed on the ortho-H2D+ map (colour scale, plus white contours as in left panel). The yellow, black, and red crosses are as in Fig. 1. The D2H+, H2D+, and N2H+ spectra along the cut traced by the dashed line are displayed in Fig. 3.
Current usage metrics show cumulative count of Article Views (full-text article views including HTML views, PDF and ePub downloads, according to the available data) and Abstracts Views on Vision4Press platform.
Data correspond to usage on the plateform after 2015. The current usage metrics is available 48-96 hours after online publication and is updated daily on week days.
Initial download of the metrics may take a while.