Fig. 1
Download original image
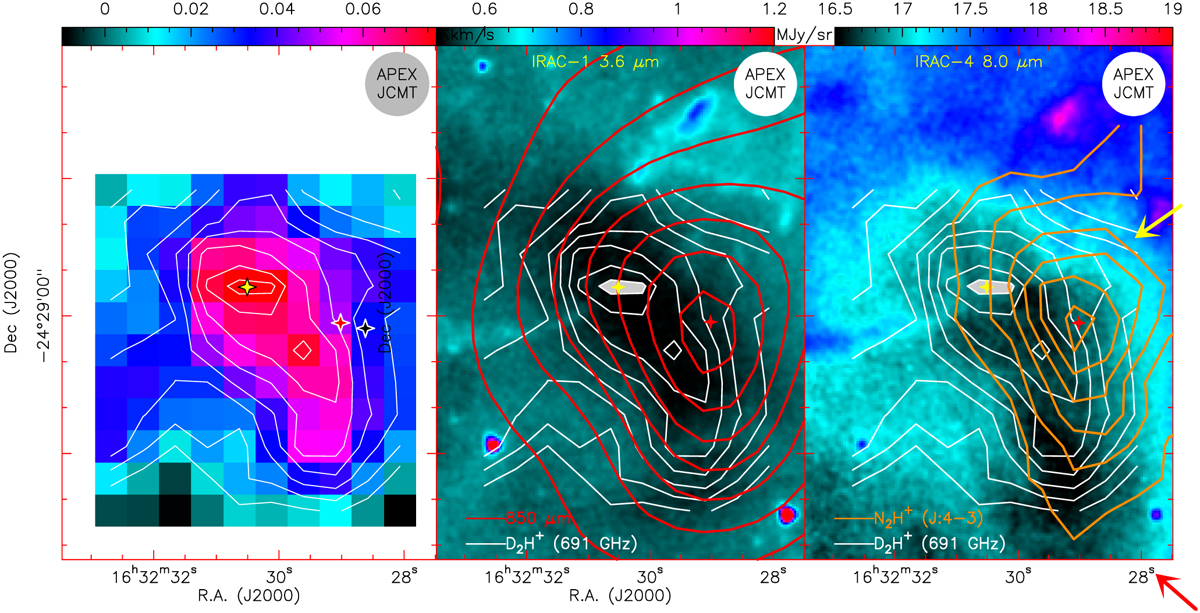
Continuum and line emission images of IRAS 16293E. Left: colour map of para-D2H+ integrated intensity emission with white contours (colour scale and white contours from 0.01 to 0.07 by 0.01 K km s−1 plus a contour at 0.075 K km s−1; contour spacing of 0.01 K km s−1 = 1.5σ) Centre: IRAC-1 image at 3.6 μm. White contours trace para-D2H+ as in the left panel. The red contours trace the SCUBA-II 850 μm emission (20–160 by 20 [≈10σ] MJy sr−1). Right: IRAC-4 image at 8.0 μm. The white contours trace para-D2H+ as in the left panel. The orange contours trace the N2H+ (J:4–3) integrated intensity (0.3 to 2.3 by 0.4 [= 12σ] K km s−1). The yellow cross marks the centre of the D2H+ emission (αJ2000: 16h32m30.51s, δJ2000: −24°28′53.7″, see also Fig. 2). The red cross marks the peak position of the dust and N2H+ (J:4–3) emissions. The black cross (left panel) marks the position of the observation of D2H+ and H2D+ by Vastel et al. (2004). The yellow arrow traces the direction of the outflow from the IRAS 16293–2422 protostellar system and the red arrow the outflow from WLY 2-69. The grey and white disks represent the JCMT and APEX beams after smoothing to 14″.
Current usage metrics show cumulative count of Article Views (full-text article views including HTML views, PDF and ePub downloads, according to the available data) and Abstracts Views on Vision4Press platform.
Data correspond to usage on the plateform after 2015. The current usage metrics is available 48-96 hours after online publication and is updated daily on week days.
Initial download of the metrics may take a while.