Open Access
Fig. 1
Download original image
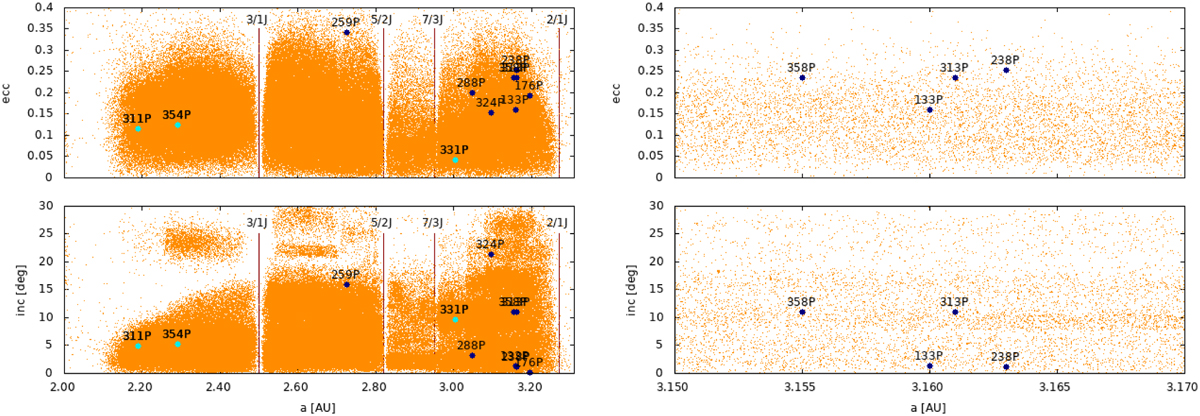
Distributions of objects selected for studies in the (a–e) and (a–i) planes. The color of the dots denotes the mass-loss mechanism: dark blue for sublimation and light green for rubble-pile disintegration or impact. The right panel presents the range 3.15–3.17 AU of the semi-major axis.
Current usage metrics show cumulative count of Article Views (full-text article views including HTML views, PDF and ePub downloads, according to the available data) and Abstracts Views on Vision4Press platform.
Data correspond to usage on the plateform after 2015. The current usage metrics is available 48-96 hours after online publication and is updated daily on week days.
Initial download of the metrics may take a while.