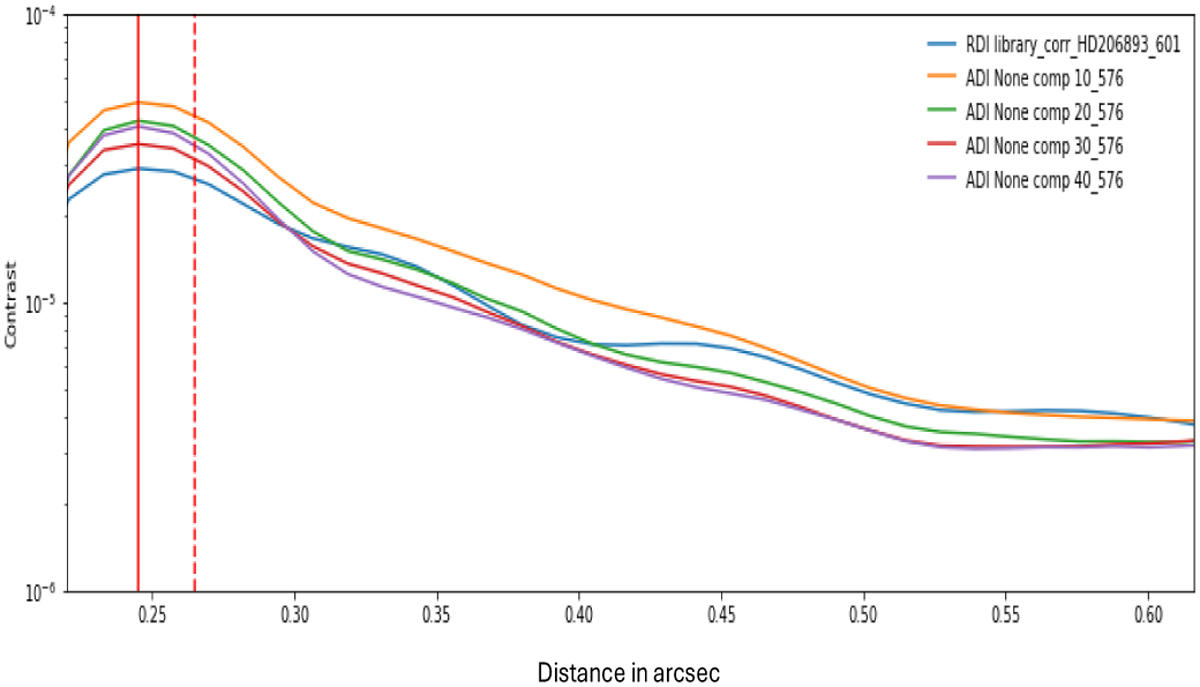
Fig. 9
Download original image
5-σ contrast curve. RSDI-PCA with correlation library (blue line) shows a better behavior than with ADI (red, green, and yellow lines); this corresponds to the components we used within this method. The library has 601 frames and it was created with N=50 and R=10, considering 70 principal components when applying the PCA. The contrast achieved with this library is 2.48 × 10⁻⁵ between 245 and 275 mas.
Current usage metrics show cumulative count of Article Views (full-text article views including HTML views, PDF and ePub downloads, according to the available data) and Abstracts Views on Vision4Press platform.
Data correspond to usage on the plateform after 2015. The current usage metrics is available 48-96 hours after online publication and is updated daily on week days.
Initial download of the metrics may take a while.