Open Access
Fig. 7
Download original image
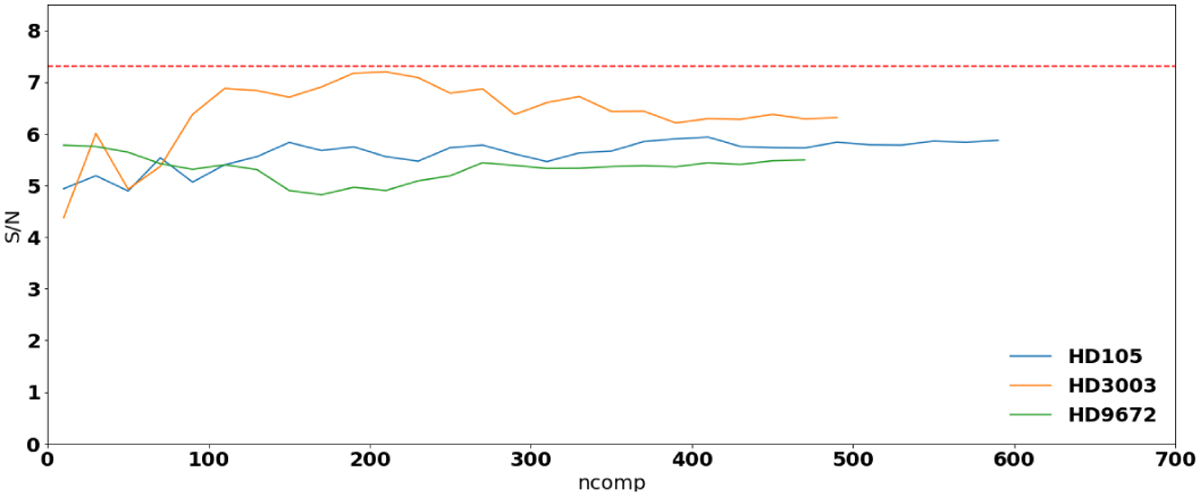
Graph shows evolution of S/N of three best performing objects vs. the number of principal components (ncomp). The best value is observed when RSDI-PCA is performed with HD 3003 as reference star using 210 principal components. The dashed line represents the S/N obtained with ADI-PCA, 7.3.
Current usage metrics show cumulative count of Article Views (full-text article views including HTML views, PDF and ePub downloads, according to the available data) and Abstracts Views on Vision4Press platform.
Data correspond to usage on the plateform after 2015. The current usage metrics is available 48-96 hours after online publication and is updated daily on week days.
Initial download of the metrics may take a while.