Fig. 2
Download original image
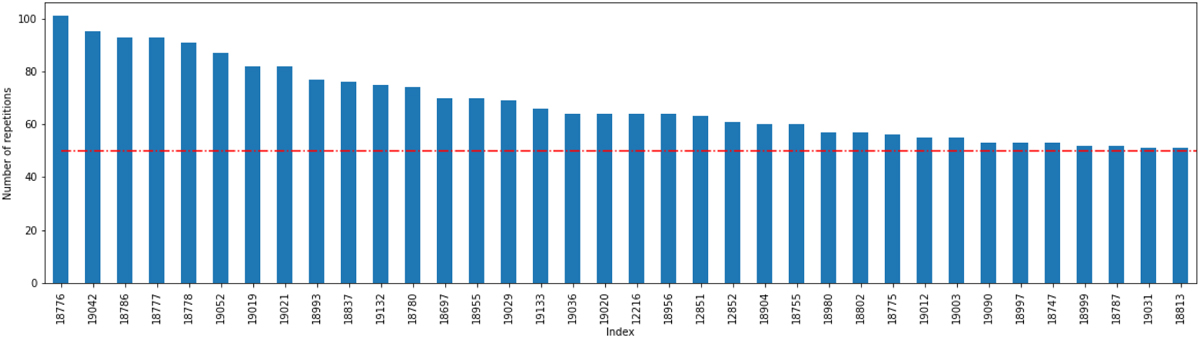
X-axis shows ID of frames included in the reference library of HD 206893 using the PCC metric. The Y-axis shows the number of times a given reference frame is among the top R=25 most similar frames when considering all the 576 scientific frames of HD 206893. A threshold N=50 (red line) was used to build the reference library; we therefore only show the reference frames present more than 50 times in the top 25 most similar frames here. This criteria (R=25, N=50) is relatively restrictive in this example, as we end up with only 36 frames in the reference library.
Current usage metrics show cumulative count of Article Views (full-text article views including HTML views, PDF and ePub downloads, according to the available data) and Abstracts Views on Vision4Press platform.
Data correspond to usage on the plateform after 2015. The current usage metrics is available 48-96 hours after online publication and is updated daily on week days.
Initial download of the metrics may take a while.