Fig. 16
Download original image
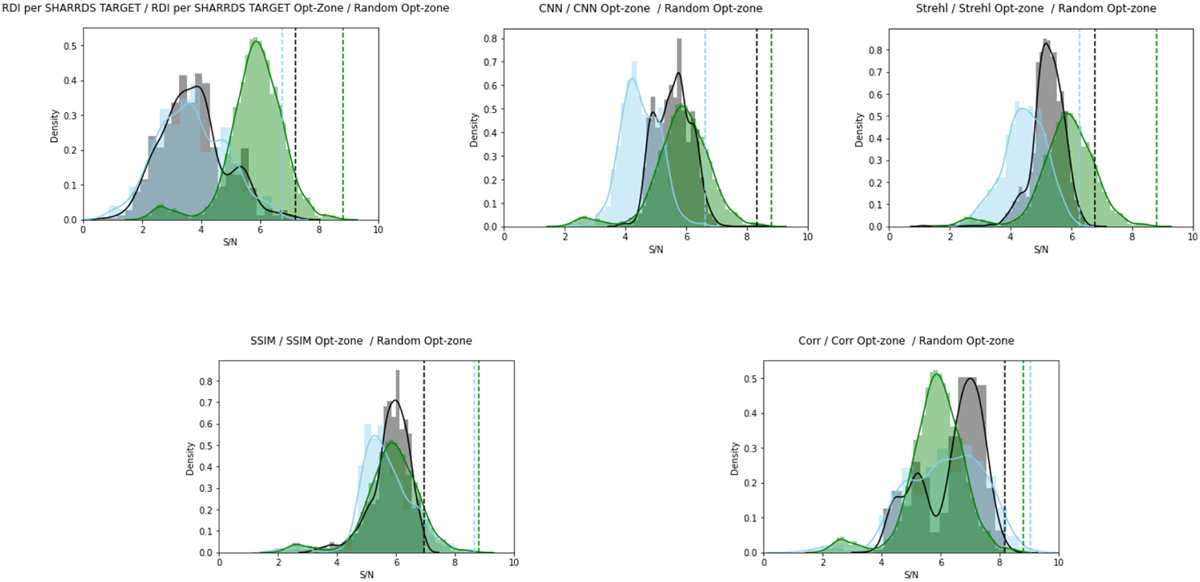
RSDI – PCA S/N density curve after having used the whole data set of SHARDDS per object; the Sthгel variable and the image similarity methods; and comparing it with the S/N values provided by the random selection (in green). The black curve corresponds to the full-frame method, the blue one to the optimization-zone method, and the green one to the random distribution; the dotted line corresponds to the maximum values per curve. The best performance is provided by the correlation with a median of 6.2 and a maximum S/N value of 9.1.
Current usage metrics show cumulative count of Article Views (full-text article views including HTML views, PDF and ePub downloads, according to the available data) and Abstracts Views on Vision4Press platform.
Data correspond to usage on the plateform after 2015. The current usage metrics is available 48-96 hours after online publication and is updated daily on week days.
Initial download of the metrics may take a while.