Fig. 15
Download original image
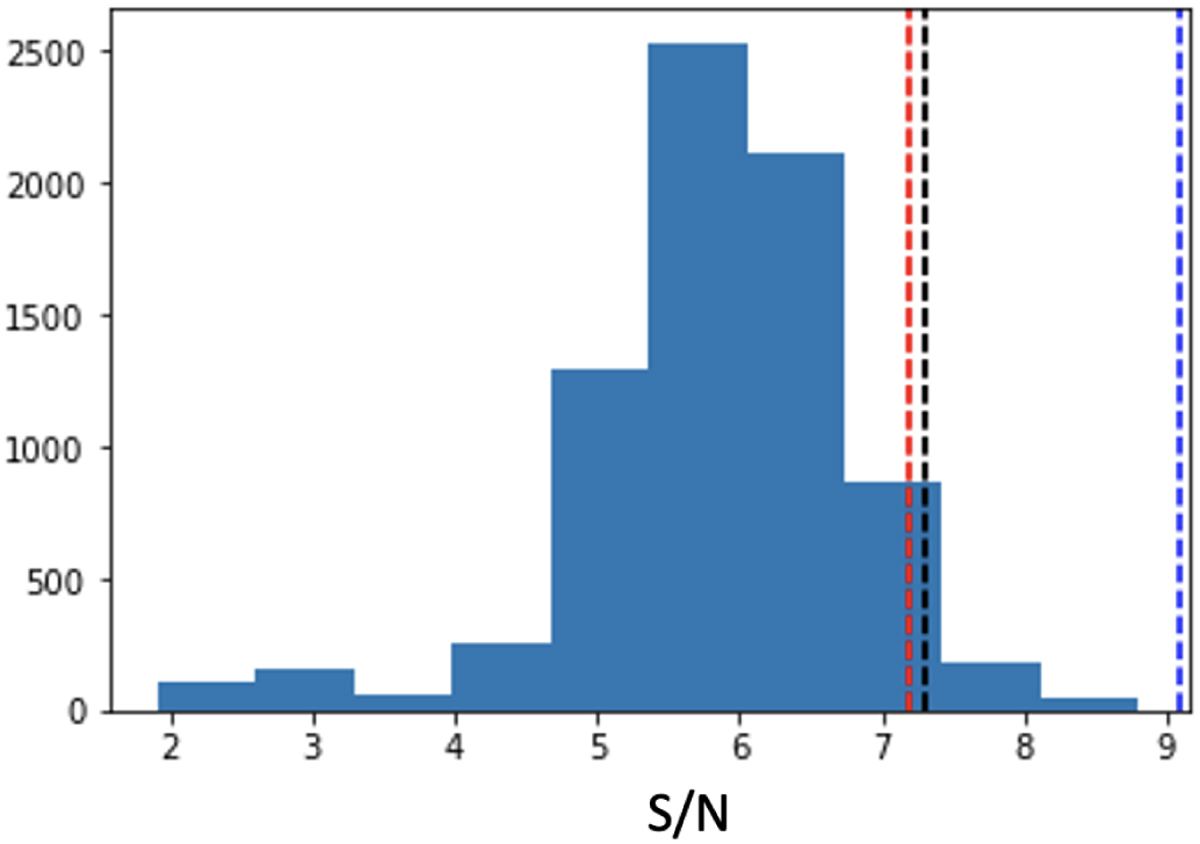
Histogram of S/N from random selection (full-frame). The red line indicates the best S/N obtained when performing single RSDI, and the black line shows the best S/N in ADI-PCA. We note 5.1% of the S/N values are above the results obtained with these two methods. The blue line is the best S/N value obtained with the correlation method with an optimized region.
Current usage metrics show cumulative count of Article Views (full-text article views including HTML views, PDF and ePub downloads, according to the available data) and Abstracts Views on Vision4Press platform.
Data correspond to usage on the plateform after 2015. The current usage metrics is available 48-96 hours after online publication and is updated daily on week days.
Initial download of the metrics may take a while.