Fig. 14
Download original image
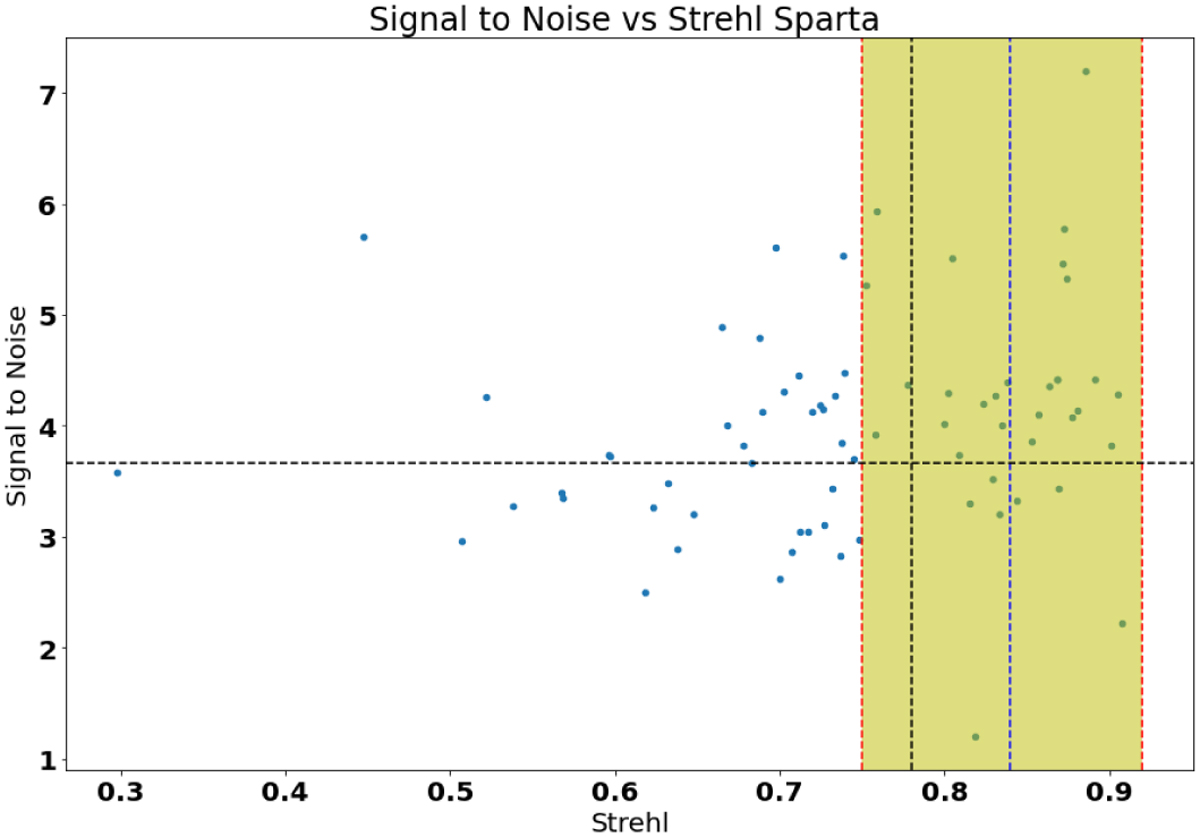
S/N as function of Stгehl ratio for the entire master reference library. The black line along the x-axis indicates the mean Strehl ratio value of 0.78. Along the y-axis, the black line represents the mean S/N obtained with single RSDI-PCA on all SHARDDS objects. The blue segmented line is the Strehl ratio value of HD 206893, 0.84, and the yellow area marks ± 10% tolerance limits with respect to this value.
Current usage metrics show cumulative count of Article Views (full-text article views including HTML views, PDF and ePub downloads, according to the available data) and Abstracts Views on Vision4Press platform.
Data correspond to usage on the plateform after 2015. The current usage metrics is available 48-96 hours after online publication and is updated daily on week days.
Initial download of the metrics may take a while.