Fig. 11
Download original image
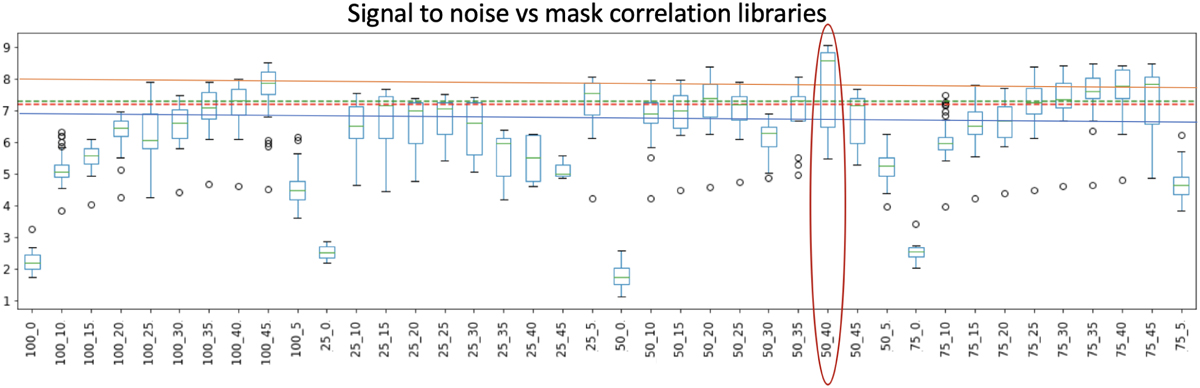
Box plot shows S/N obtained with all the reference libraries created with the correlation method using the optimized zone, identified in the x-axis by the respective N and R values (in the format N_R). The horizontal lines indicate the best S/N achieved with the ADI-PCA full-frame (red dashed line) and optimized zones (orange line), and the single RSDI (green dashed line) and optimized zones (blue line). The maximum S/N value is 9.1, achieved with N=40 and R=50.
Current usage metrics show cumulative count of Article Views (full-text article views including HTML views, PDF and ePub downloads, according to the available data) and Abstracts Views on Vision4Press platform.
Data correspond to usage on the plateform after 2015. The current usage metrics is available 48-96 hours after online publication and is updated daily on week days.
Initial download of the metrics may take a while.