Fig. 2.
Download original image
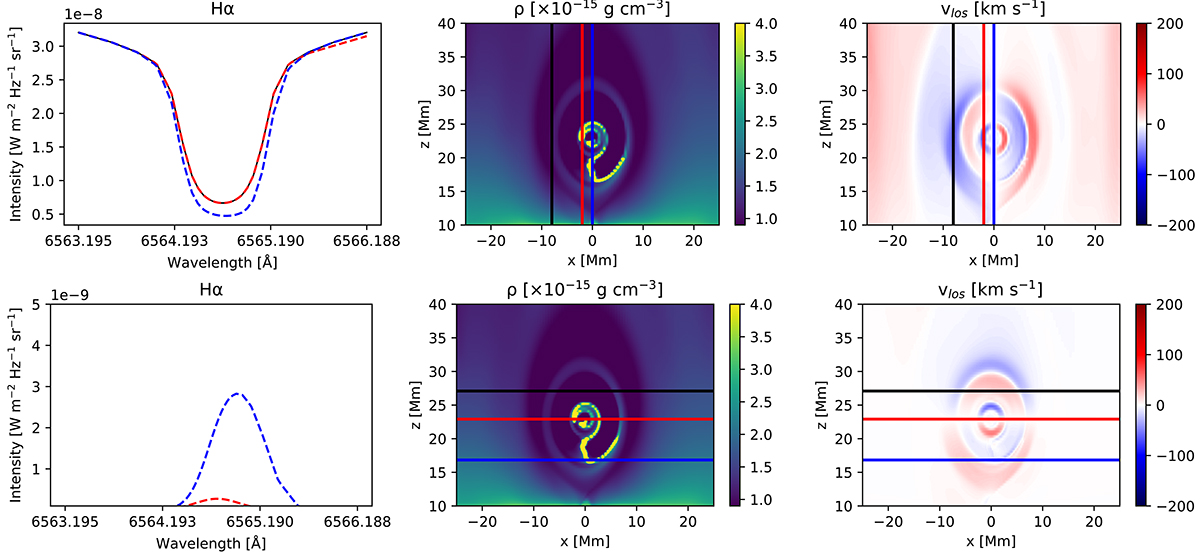
Example synthesized spectra along three rays at t = 85 min. We show a ray representing the background (in black), rotating condensation (in red), and an oscillating tail (in blue). The top row shows the spectra resulting from filament synthesis, with the three rays marked on the line-of-sight velocity and density map. Here the black line overlaps with the red line everywhere except at the red wing. The bottom row shows the same but for prominence synthesis, with the black line being close to zero across the spectrum. An animated version of both views is available online (see movie 2 and movie 3).
Current usage metrics show cumulative count of Article Views (full-text article views including HTML views, PDF and ePub downloads, according to the available data) and Abstracts Views on Vision4Press platform.
Data correspond to usage on the plateform after 2015. The current usage metrics is available 48-96 hours after online publication and is updated daily on week days.
Initial download of the metrics may take a while.