Fig. 5
Download original image
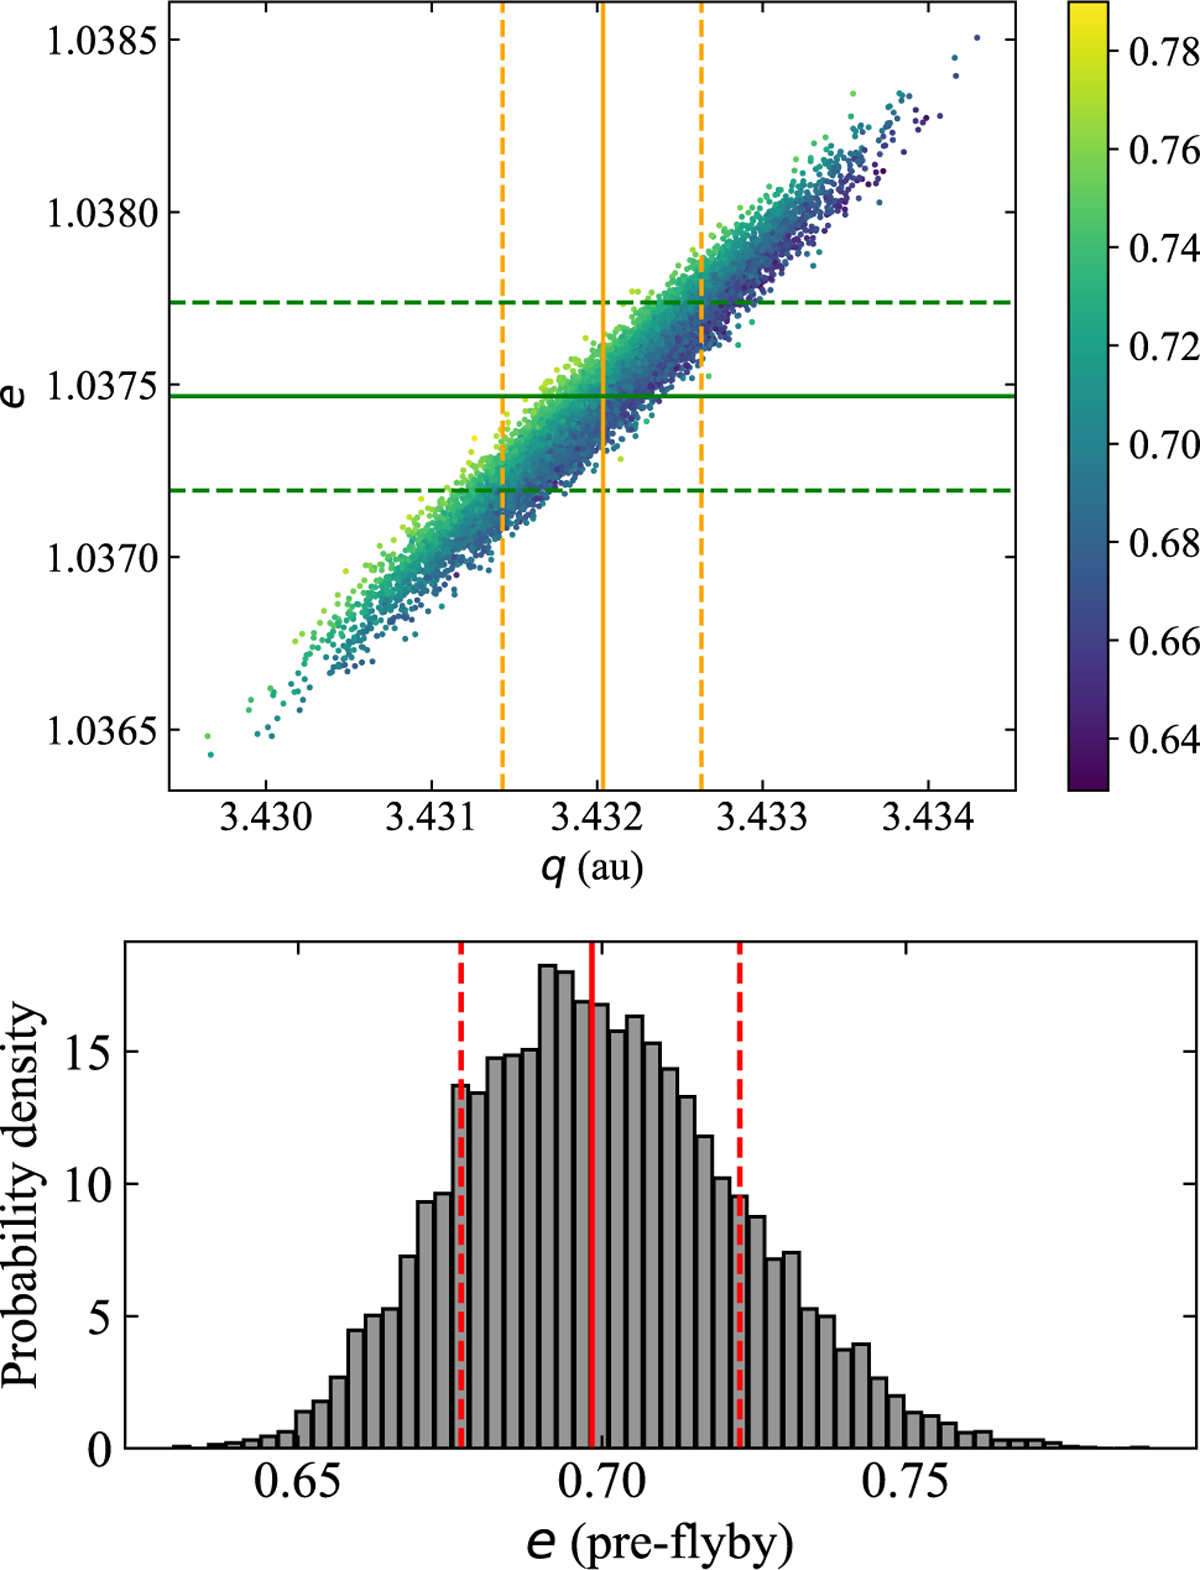
Distribution of the pre-flyby eccentricity of C/2024 L5 (ATLAS). Top panel :values of the pre-flyby eccentricity (color-coded) as a function of the input values of (q, e) at t = 0. Median values are shown as continuous (green for e, orange for q) lines, 16th and 84th percentiles as dashed lines. Bottom panel: distribution of the computed pre-flyby eccentricity. The median is displayed as a continuous red line, 16th and 84th percentiles as dashed lines, 0.70±0.02.
Current usage metrics show cumulative count of Article Views (full-text article views including HTML views, PDF and ePub downloads, according to the available data) and Abstracts Views on Vision4Press platform.
Data correspond to usage on the plateform after 2015. The current usage metrics is available 48-96 hours after online publication and is updated daily on week days.
Initial download of the metrics may take a while.