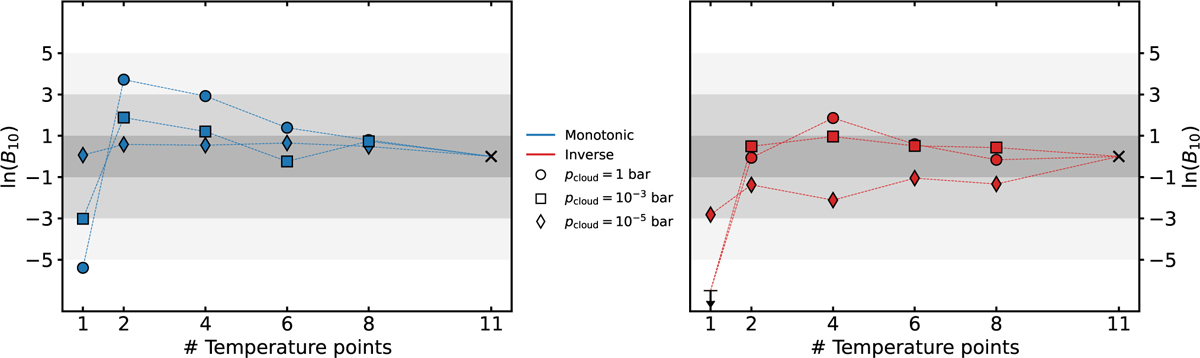
Fig. 4
Download original image
Bayesian evidence comparison for retrievals in all cases of the synthetic dataset associated with the DRS noise case, split into the synthetic spectra generated using the monotonic input p–T profile (left) and the inverse input p–T profile (right). Both panels show the number of retrieved temperature points (corresponding the implemented multi-point profile) on the x-axis and the model-associated Bayes factor on the y-axis. Data points are separated into spectra generated with high (pcloud = 1 bar, circles), medium (pcloud = 10−3 bar, squares), and low (pcloud = 10−5 bar, diamonds) cloud-top pressure input values. The grey shaded area denotes the Bayes factor threshold given in Table 3. The black cross denotes the reference model in all cases (eleven-point p–T profile), and Bayes factor values fulfilling |ln B10| > 6.0 are denoted by a black arrow.
Current usage metrics show cumulative count of Article Views (full-text article views including HTML views, PDF and ePub downloads, according to the available data) and Abstracts Views on Vision4Press platform.
Data correspond to usage on the plateform after 2015. The current usage metrics is available 48-96 hours after online publication and is updated daily on week days.
Initial download of the metrics may take a while.