Fig. 9.
Download original image
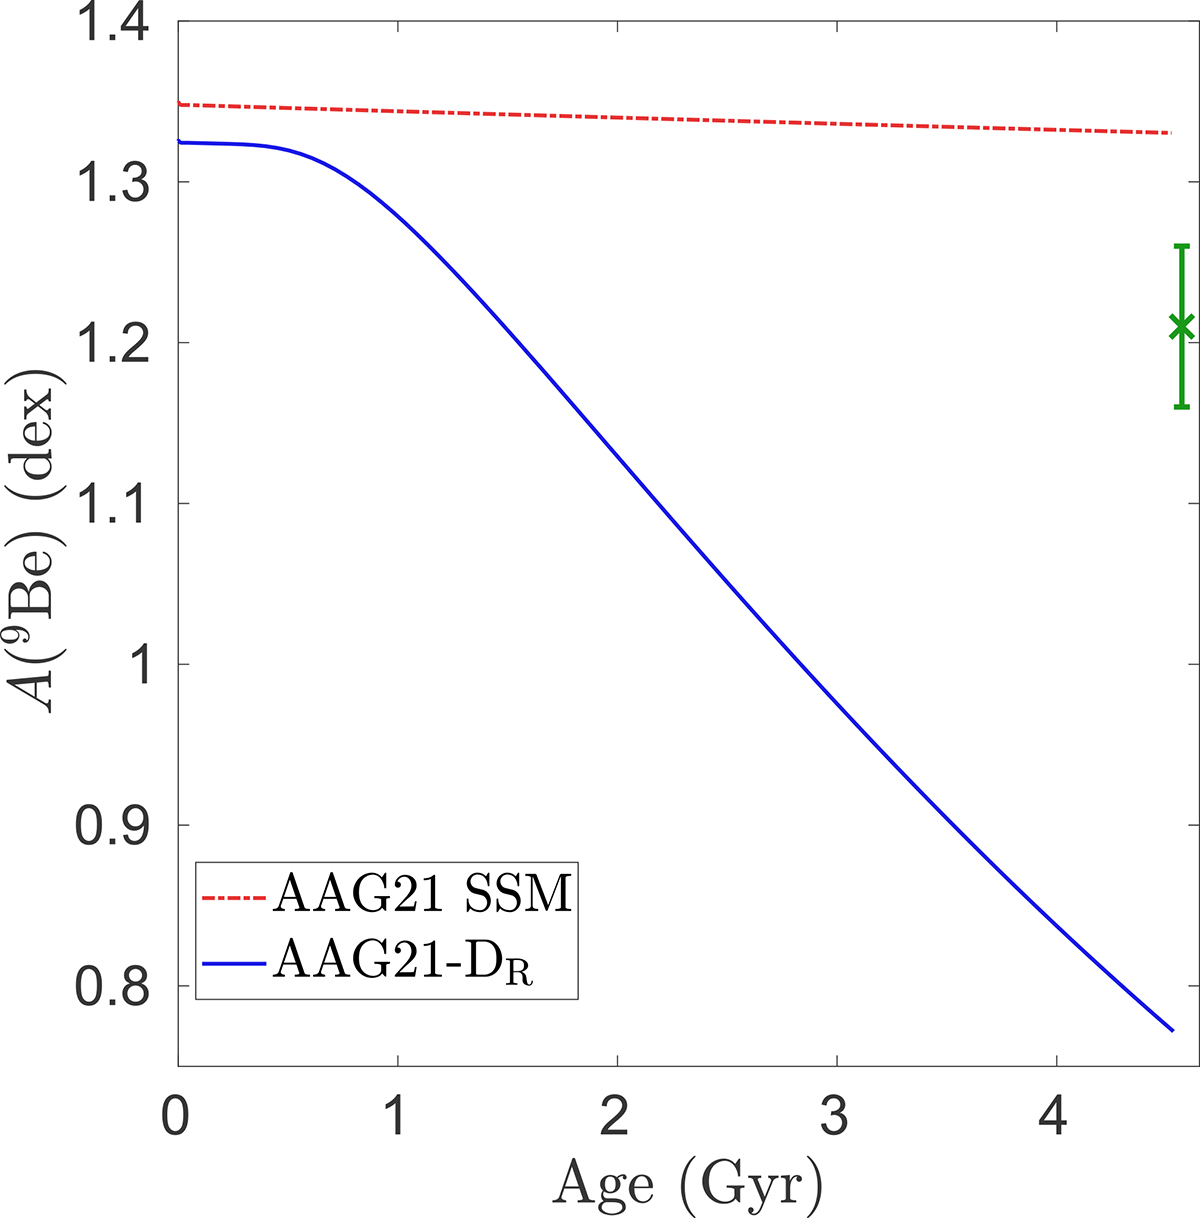
Predicted evolution of the surface beryllium abundance with different theoretical models. Red shows a standard solar model (SSM); blue shows a model that includes the effects of angular momentum transport (DR). The point at 4.6 Gyr shows the current value of the surface beryllium abundance that was determined in Section 3.3.
Current usage metrics show cumulative count of Article Views (full-text article views including HTML views, PDF and ePub downloads, according to the available data) and Abstracts Views on Vision4Press platform.
Data correspond to usage on the plateform after 2015. The current usage metrics is available 48-96 hours after online publication and is updated daily on week days.
Initial download of the metrics may take a while.