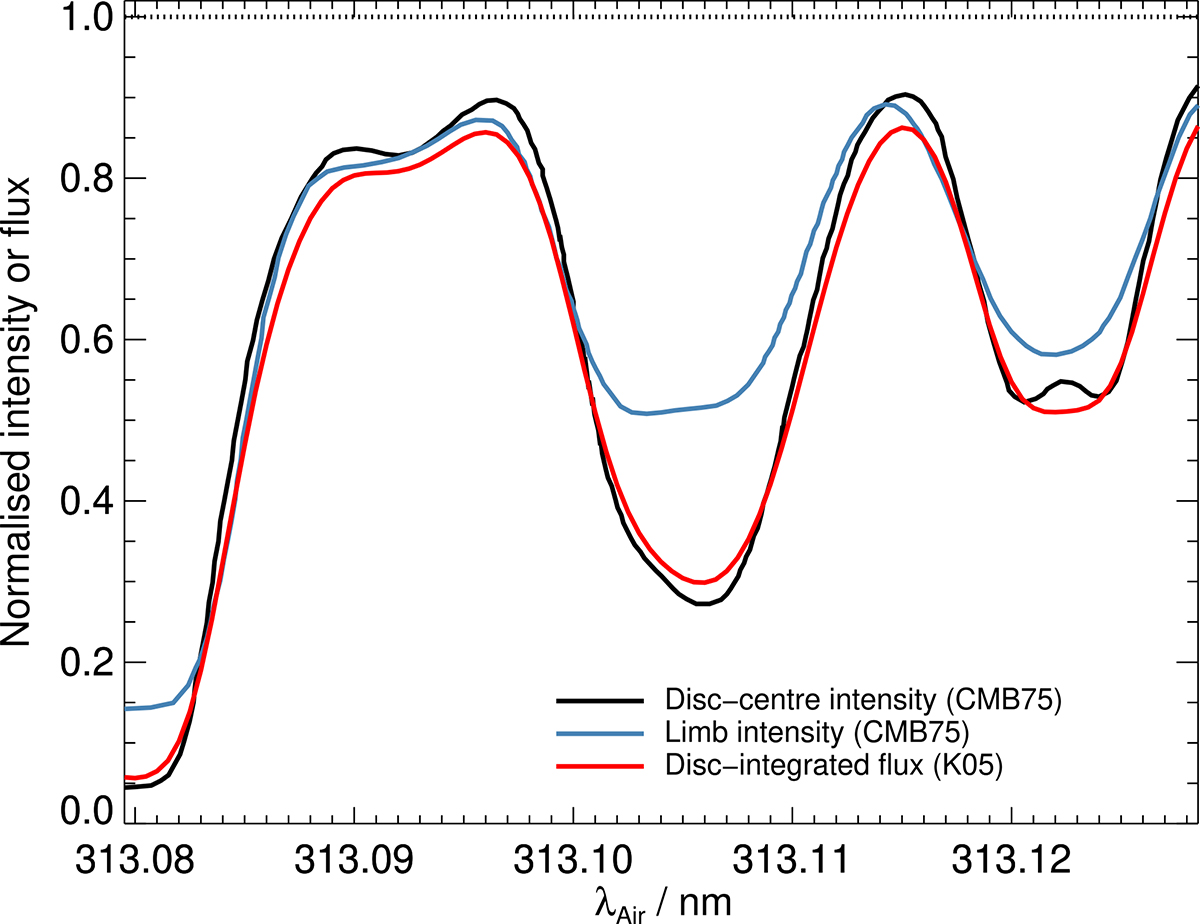
Fig. 6.
Download original image
Continuum-normalised observational data used for spectral line fitting, over-plotted for comparison. Disc-centre and limb intensities from Chmielewski et al. (1975), and disc-integrated flux from Kurucz (2005). All spectra are plotted as a function of wavelength in air and are already corrected for the solar gravitational redshift.
Current usage metrics show cumulative count of Article Views (full-text article views including HTML views, PDF and ePub downloads, according to the available data) and Abstracts Views on Vision4Press platform.
Data correspond to usage on the plateform after 2015. The current usage metrics is available 48-96 hours after online publication and is updated daily on week days.
Initial download of the metrics may take a while.