Fig. 5.
Download original image
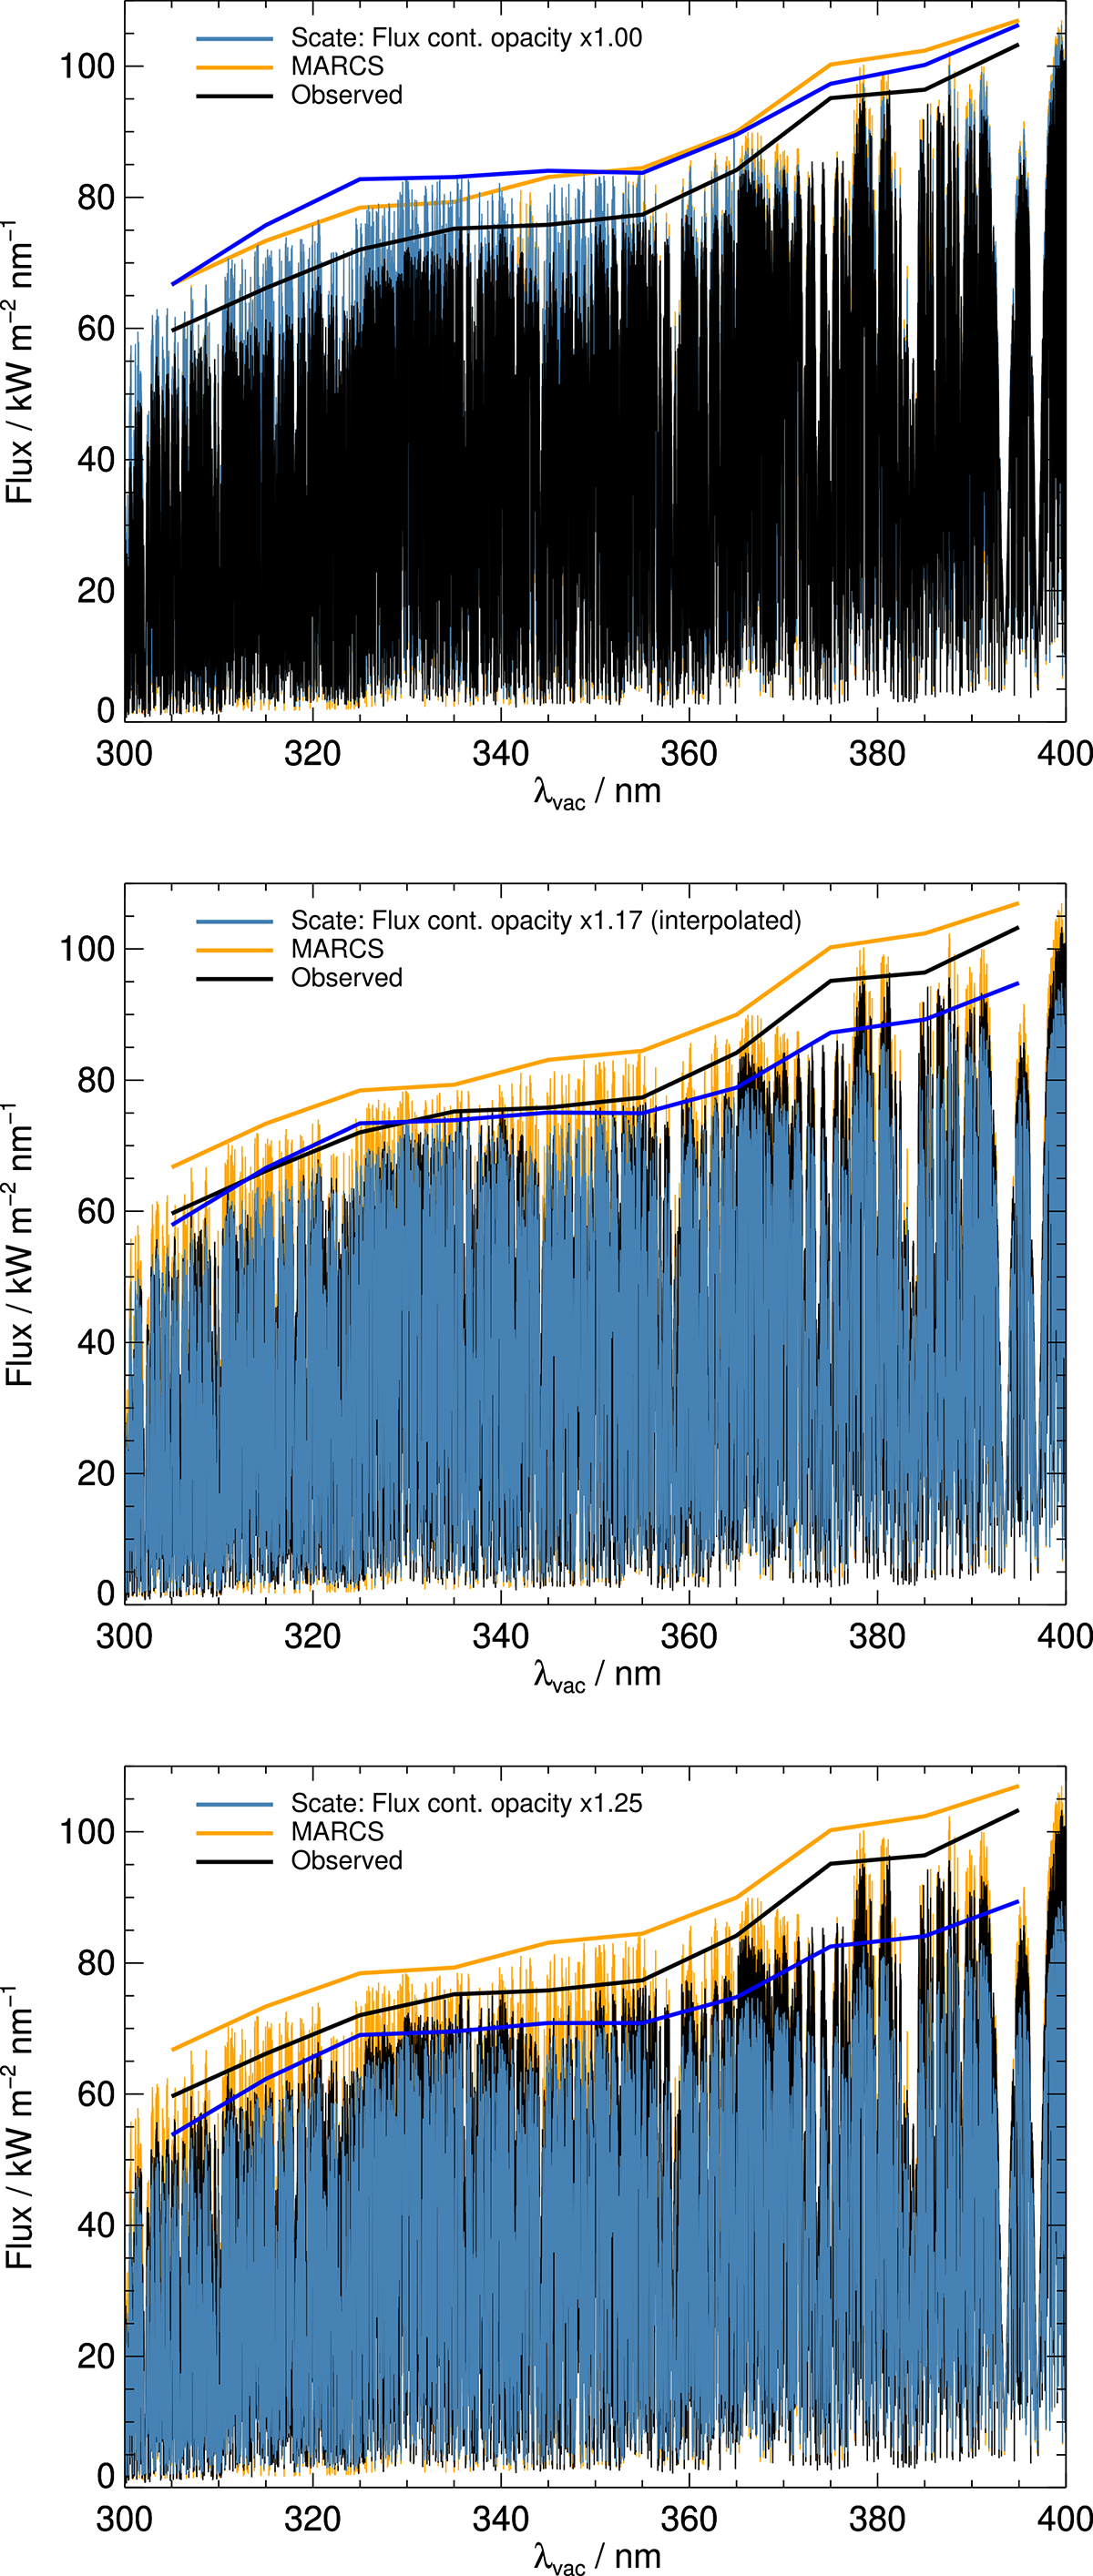
Disc-integrated flux at the solar surface. Two sets of theoretical data are shown: the Scate data are from this work, while the MARCS data are from Gustafsson et al. (2008). Also shown are results derived from the solar irradiance atlas of Kurucz (2005). The Scate data are shown without any scaling of the continuous opacity (top panel), and with a factor of 1.25 applied (bottom panel), as well as with a factor of 1.17 applied as determined by interpolation (middle panel). The continua are approximately traced by taking maxima within bins of widths of 10 nm.
Current usage metrics show cumulative count of Article Views (full-text article views including HTML views, PDF and ePub downloads, according to the available data) and Abstracts Views on Vision4Press platform.
Data correspond to usage on the plateform after 2015. The current usage metrics is available 48-96 hours after online publication and is updated daily on week days.
Initial download of the metrics may take a while.