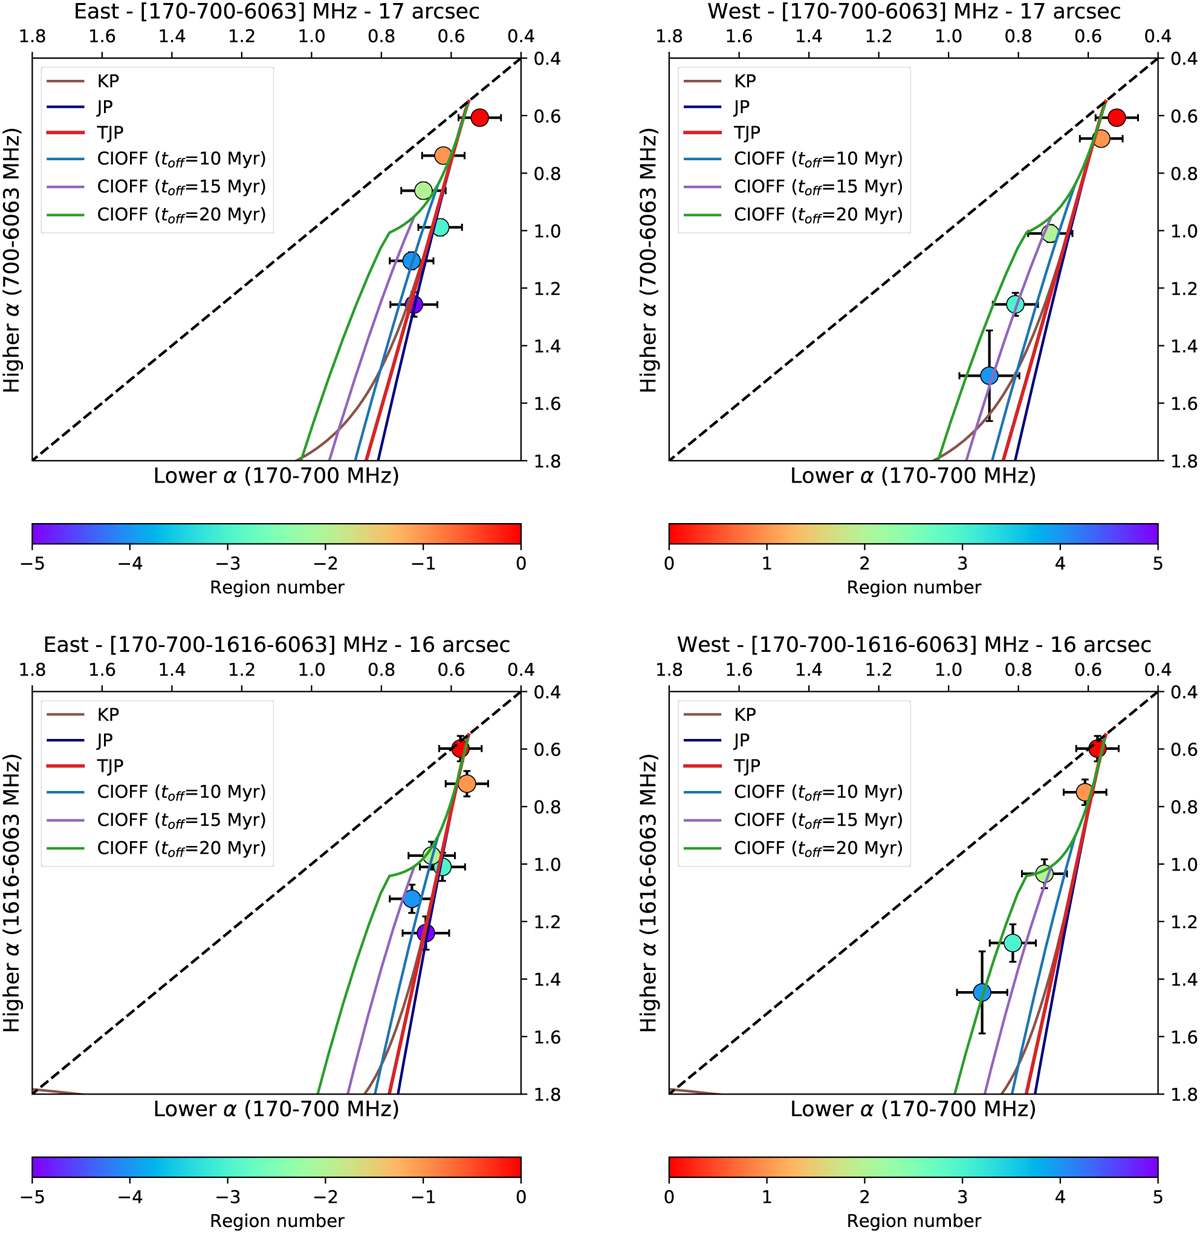
Fig. 9
Download original image
Radio colour-colour diagrams. Data points are coloured based on the sampling (beam-size) region identifier as in Fig. 7. The black dashed line (one-to-one line) indicates a power-law with α = Γ. The solid lines are the theoretical KP (brown), JP (blue), TJP (red), CIOFF (cyan, purple, green for toff = 10, 15, 20 Myr, respectively) ageing curves obtained with Γ = 0.55 and B0 = 2.4 μG. The direction (eastward or westward) of the sampling with respect to region ‘0’ (centred on the radio core), frequency pairs, and resolution are indicated on top of each panel.
Current usage metrics show cumulative count of Article Views (full-text article views including HTML views, PDF and ePub downloads, according to the available data) and Abstracts Views on Vision4Press platform.
Data correspond to usage on the plateform after 2015. The current usage metrics is available 48-96 hours after online publication and is updated daily on week days.
Initial download of the metrics may take a while.