Fig. 4
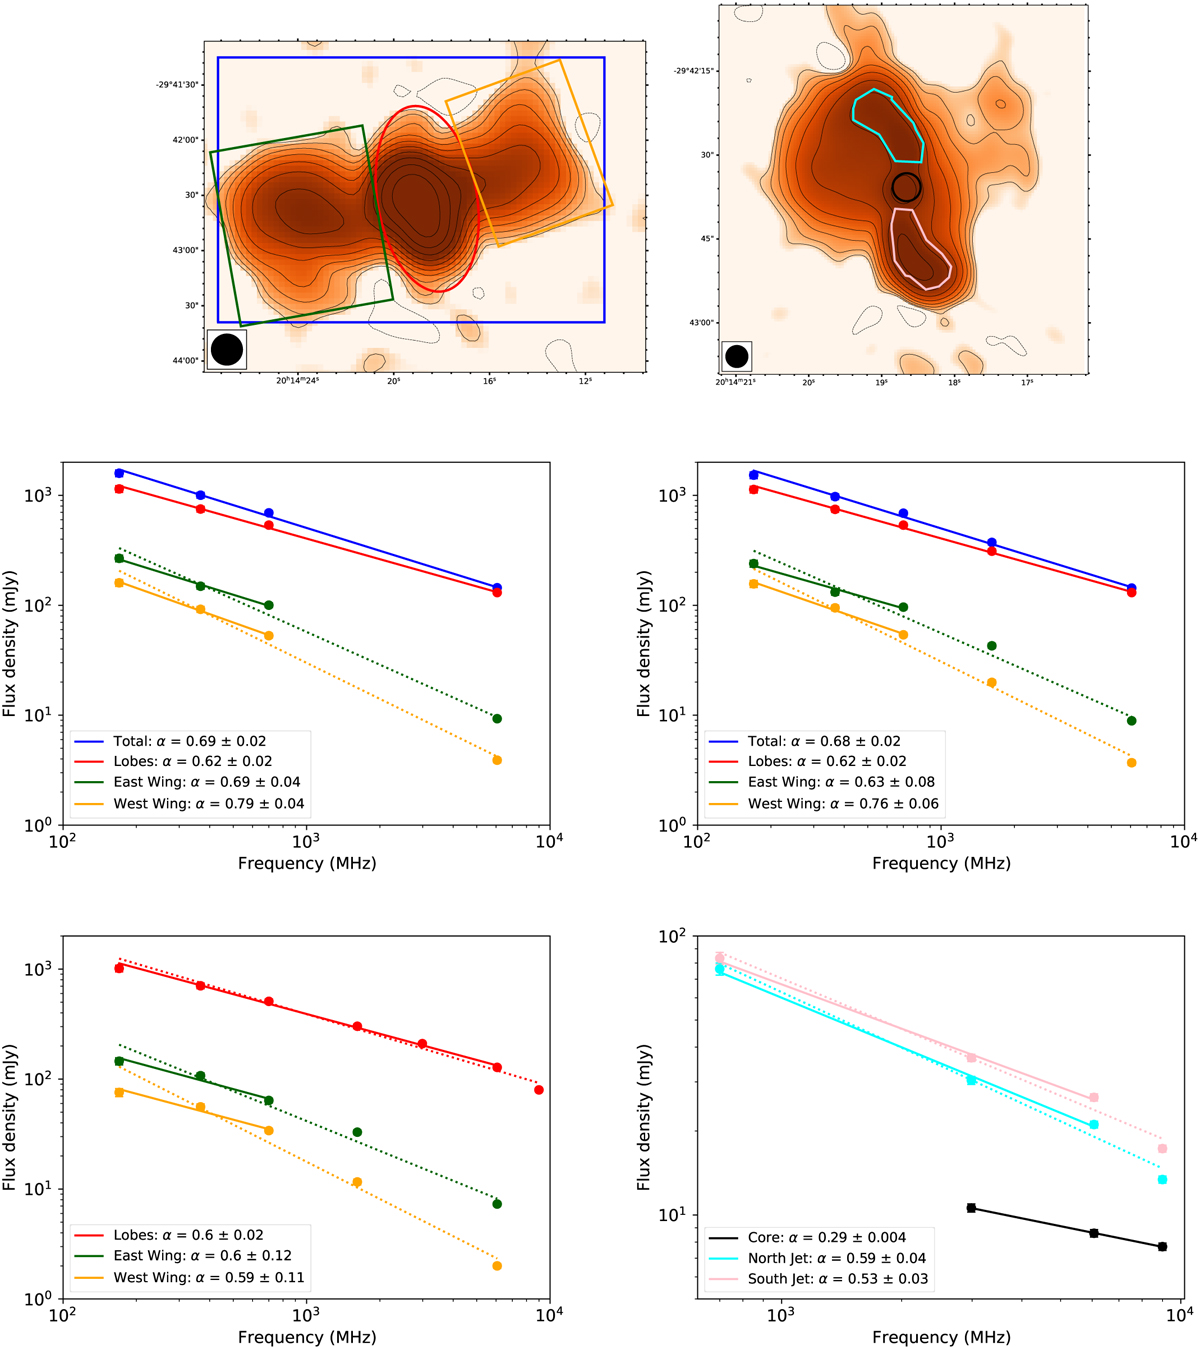
Download original image
Radio spectrum of MRC 2011-298. Upper panels report the 700 MHz (left) and 9000 MHz (right) images with overlaid an example of the regions used to measure the flux densities of the whole source (blue box), lobes (red ellipse), east wing (green box), west wing (orange box), core (black circle), north jet (cyan polygonal), and south jet (pink polygonal). Middle and lower panels show the spectra obtained for sets of images A, B, C, and D (Table 4). Dashed and solid lines are the fitted power-laws to all data points and to subsets of data points, respectively. Results of the fits are summarised in Table 5.
Current usage metrics show cumulative count of Article Views (full-text article views including HTML views, PDF and ePub downloads, according to the available data) and Abstracts Views on Vision4Press platform.
Data correspond to usage on the plateform after 2015. The current usage metrics is available 48-96 hours after online publication and is updated daily on week days.
Initial download of the metrics may take a while.