Fig. 3

Download original image
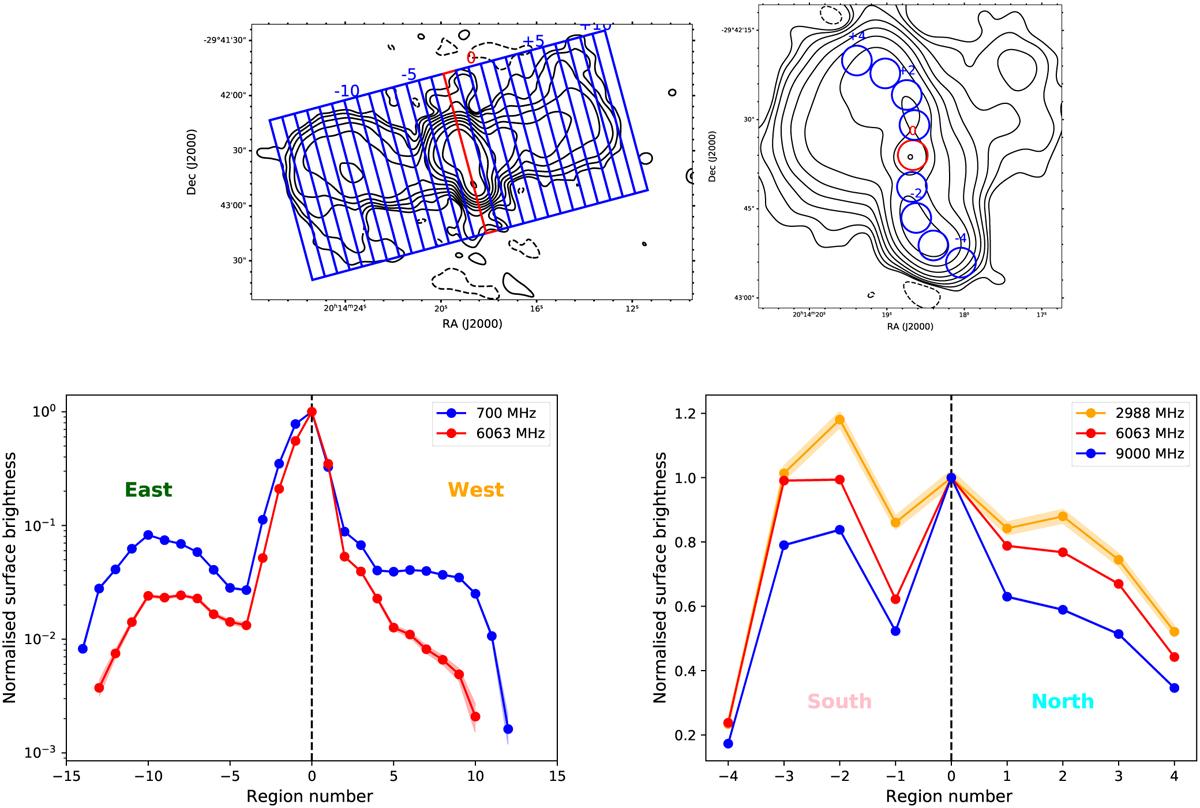
Radio surface brightness profiles of MRC 2011-298. Top: Sampling regions overlaid on the radio contours at 700 (left) and 9000 (right) MHz. The identifier of the sampling regions increases towards north and west, and decreases towards south and east with respect to region ‘0’ (in red), which includes the radio core. Bottom left: Profiles of the active lobes and wings measured at 700 (blue) and 6063 (red) MHz in boxes of beam-size (7″) width, and normalised by the brightness of region ‘0’ (dashed black line). Bottom right: Profiles of the jets measured at 2988 (orange), 6063 (red), and 9000 (blue) MHz in beam-size (4.5″) circles, normalised by the brightness of region ‘0’ (dashed black line).
Current usage metrics show cumulative count of Article Views (full-text article views including HTML views, PDF and ePub downloads, according to the available data) and Abstracts Views on Vision4Press platform.
Data correspond to usage on the plateform after 2015. The current usage metrics is available 48-96 hours after online publication and is updated daily on week days.
Initial download of the metrics may take a while.


