Fig. 8.
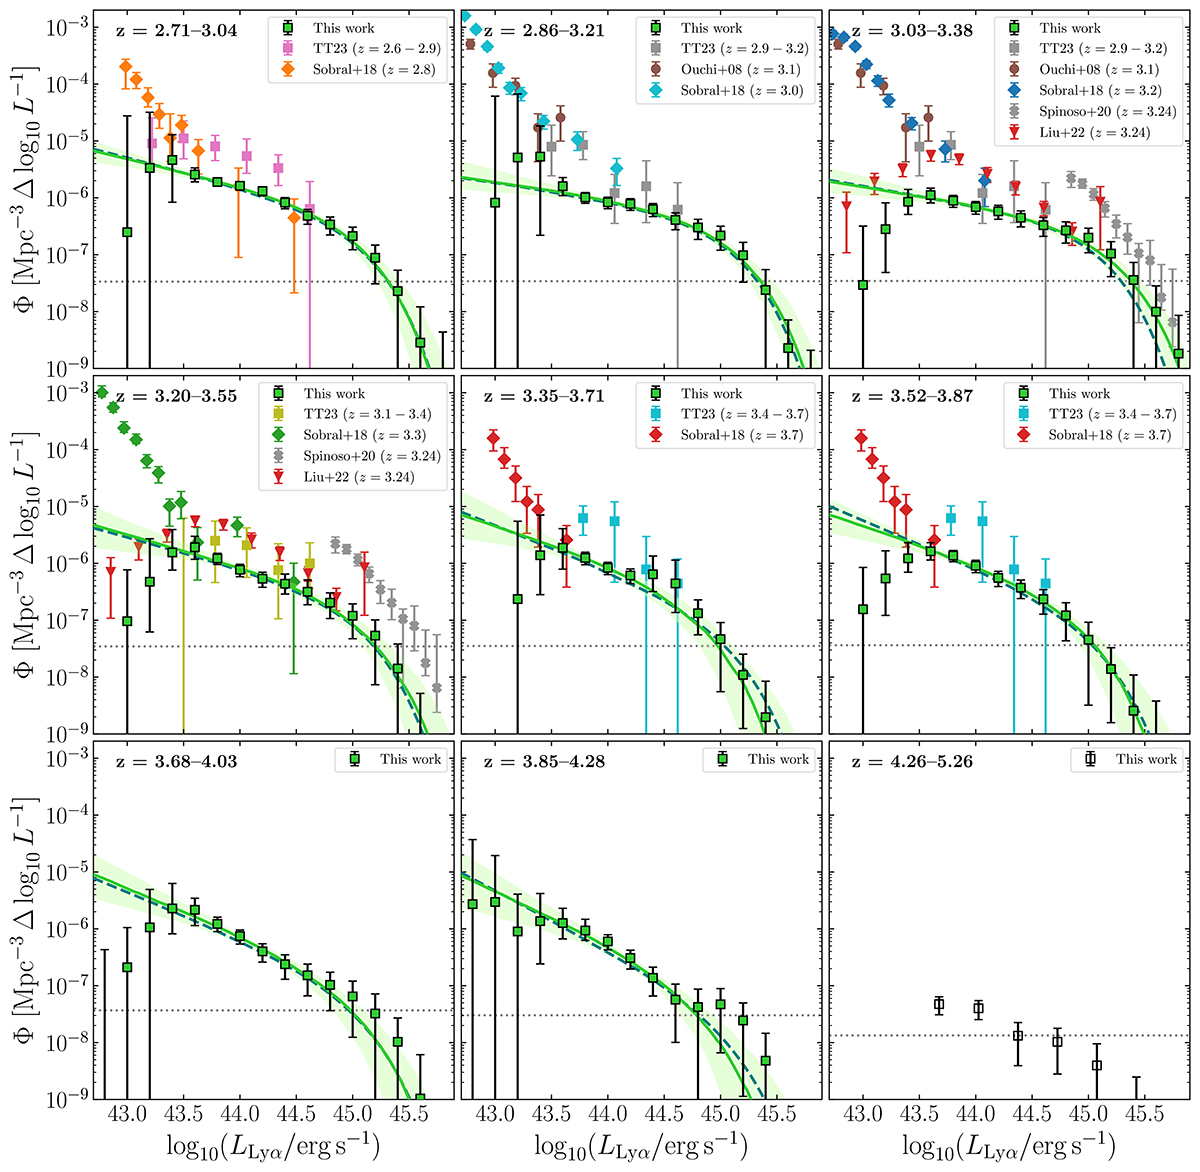
Download original image
Lyα luminosity function in nine intervals of redshift defined in Table 1. We compare with Lyα LFs in the literature at similar redshifts. The green solid line and blue shaded area show the best Schechter fit with free parameters and the 1σ confidence interval, respectively. The dashed blue line shows the Schechter best fit for fixed L* = 45 erg s−1. The Lyα LF of the highest-redshift bin shown in this figure was computed assuming purity and completeness equal to 1, and therefore it should be regarded as a lower limit (see Sect. 4.2). The horizontal gray dotted line marks the 1 object per bin level. Data points below this limit signal LF bins that contain less than one object after we average out the 1000 LF determinations used to compute our final LF.
Current usage metrics show cumulative count of Article Views (full-text article views including HTML views, PDF and ePub downloads, according to the available data) and Abstracts Views on Vision4Press platform.
Data correspond to usage on the plateform after 2015. The current usage metrics is available 48-96 hours after online publication and is updated daily on week days.
Initial download of the metrics may take a while.