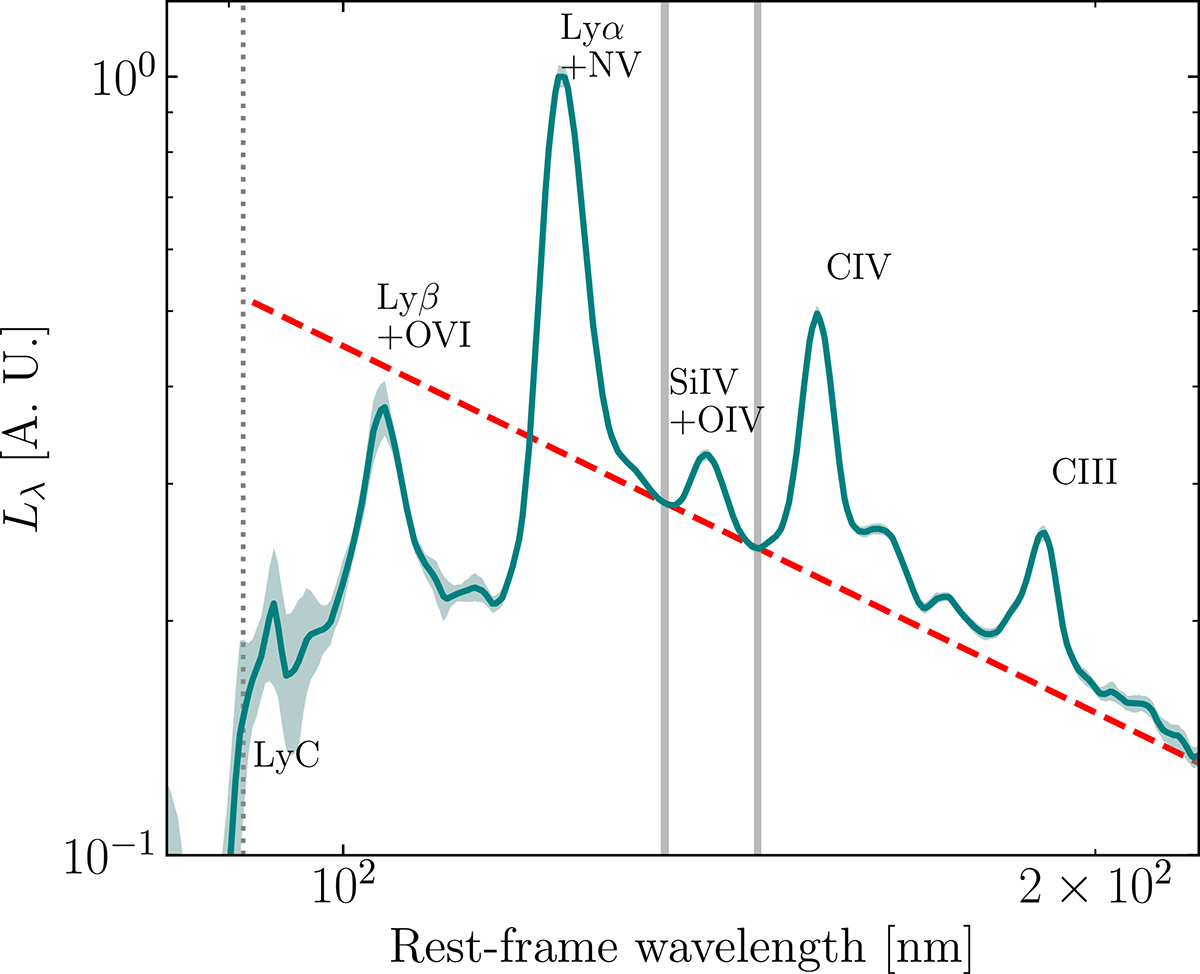
Fig. 7.
Download original image
Stacked composite spectrum of all QSOs in our golden sample. We show the mean composite spectrum (teal solid line) and bootstrap 1σ interval (shaded region). The shaded gray regions mark the rest-frame wavelength intervals used to fit a power-law continuum. We represent the fitted power law as a dashed red line, whose slope is βUV = −1.55 ± 0.02. We show the labels of the most important QSO emission lines and the LyC limit (91.2 nm).
Current usage metrics show cumulative count of Article Views (full-text article views including HTML views, PDF and ePub downloads, according to the available data) and Abstracts Views on Vision4Press platform.
Data correspond to usage on the plateform after 2015. The current usage metrics is available 48-96 hours after online publication and is updated daily on week days.
Initial download of the metrics may take a while.