Fig. 5.
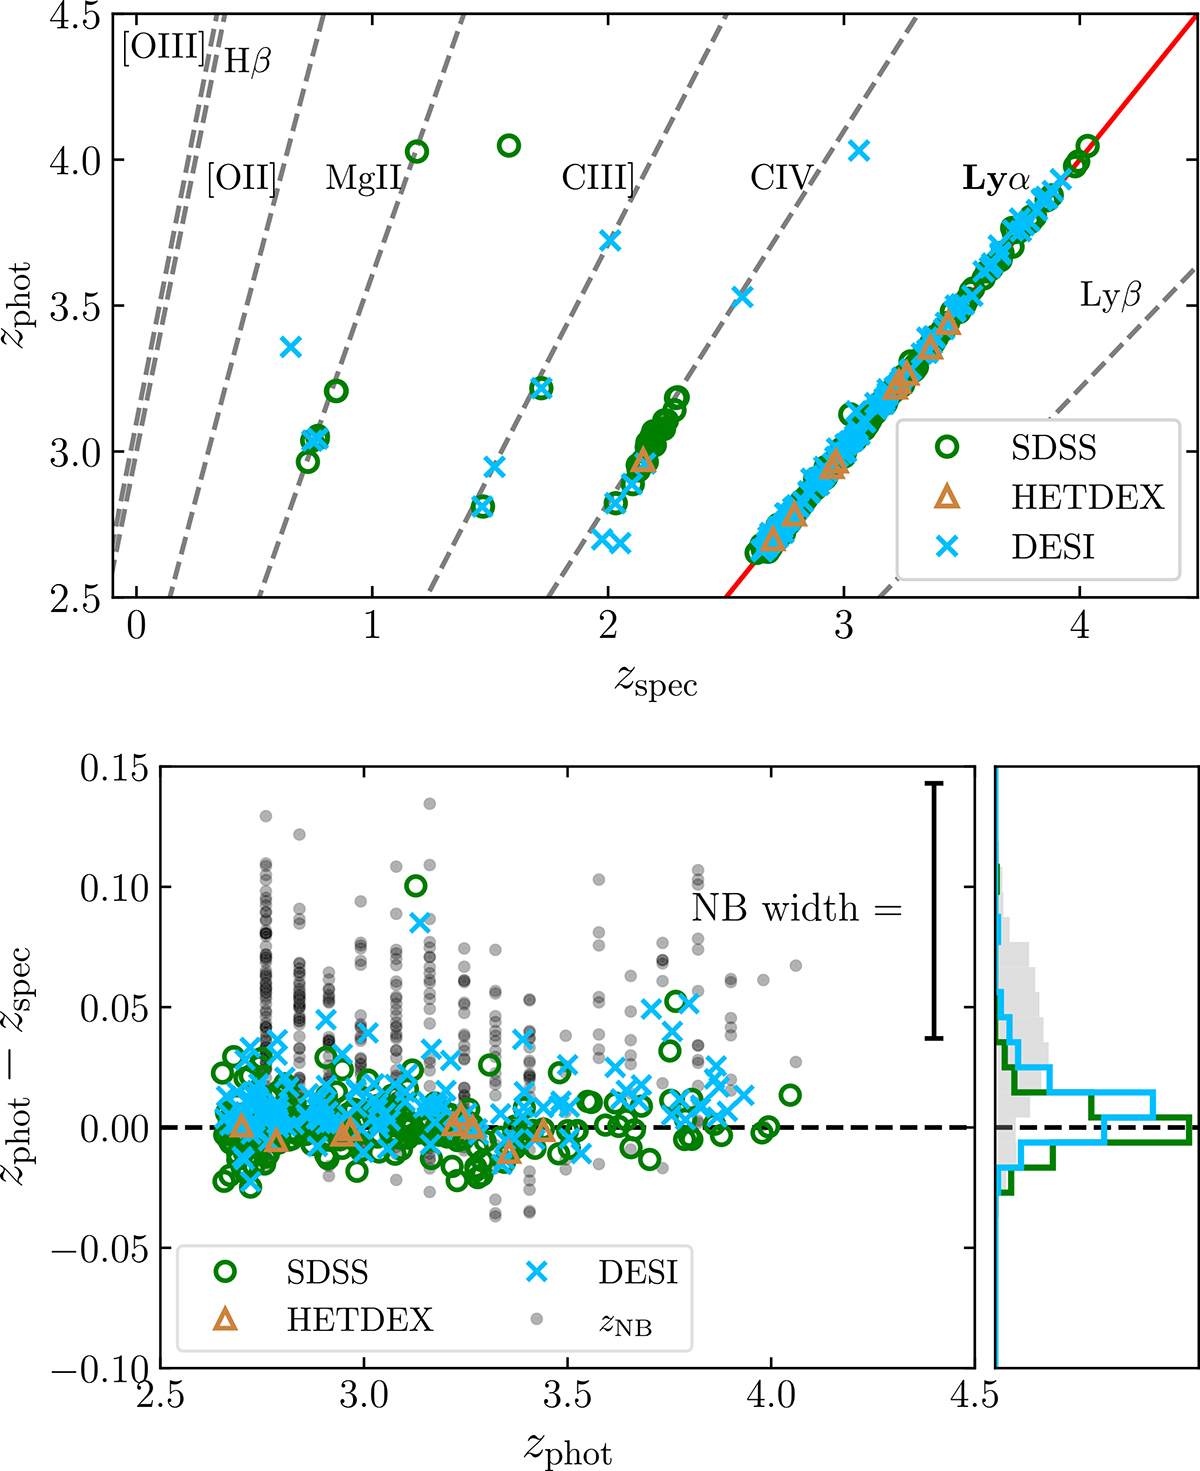
Download original image
Comparison between photometric and spectroscopic redshifts. Top: Comparison between photometric and spectroscopic redshifts of the candidates in our sample with counterparts in SDSS DR18 (green circles) HETDEX (orange triangles) and DESI DR1 (blue crosses). The straight lines mark the confusion between Lyα and other bright QSO lines. Thus, objects lying on the red line are true positive detections of LAEs. Bottom: Difference between the photometric and spectroscopic redshifts of the objects shown in the top panel. The black dots represent the same objects using the photometric redshift of the selection NB, before applying the machine-learning algorithm presented in Sect. 3.2.6. The colored dots represent the same objects after the random forest redshift correction, for each spectroscopic subsample. The bottom right panel shows normalized histograms, the result of collapsing the left panel in the horizontal axis. The HETDEX histogram is not shown because of poor statistics.
Current usage metrics show cumulative count of Article Views (full-text article views including HTML views, PDF and ePub downloads, according to the available data) and Abstracts Views on Vision4Press platform.
Data correspond to usage on the plateform after 2015. The current usage metrics is available 48-96 hours after online publication and is updated daily on week days.
Initial download of the metrics may take a while.