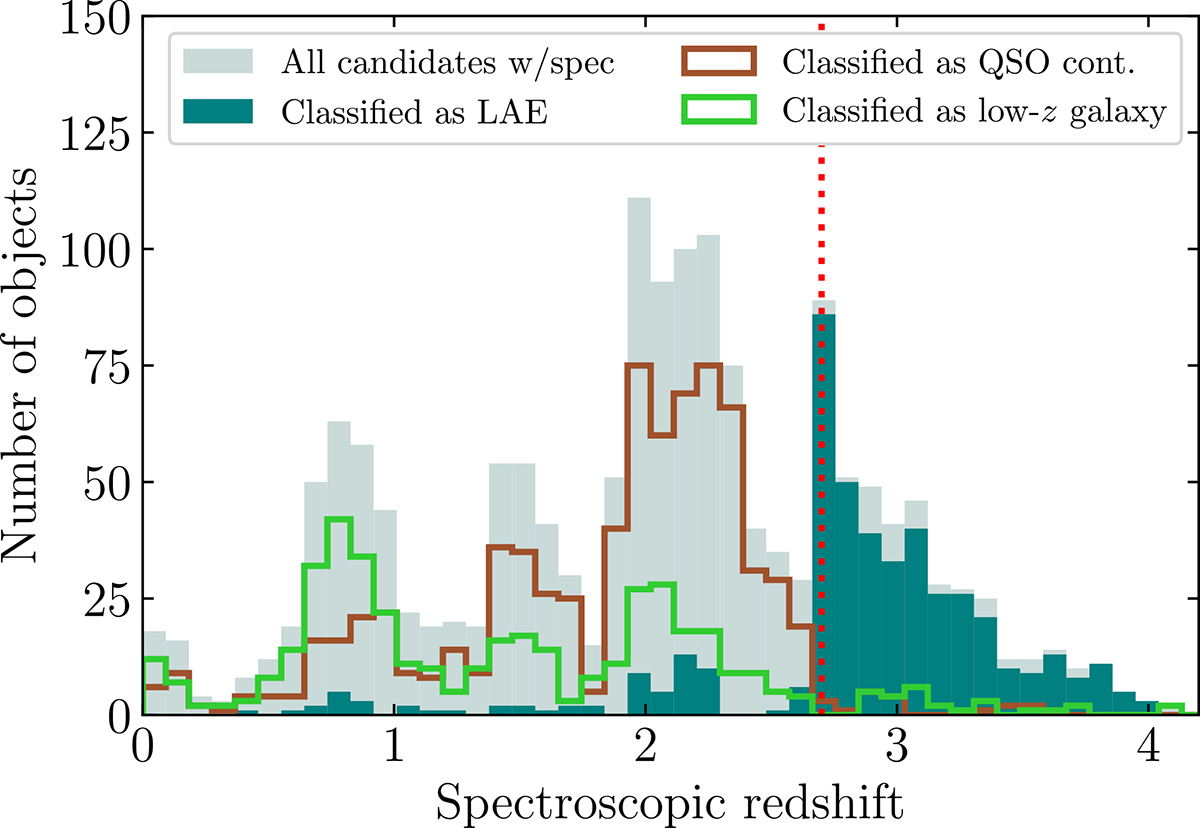
Fig. 4.
Download original image
Classification of the candidates with a spectroscopic counterpart by our ANN algorithm. The solid light-teal histogram represents the full spectroscopic sample, and the solid dark blue the subsample classified as LAE by the NN. The empty brown and green histograms represent the candidates classified as contaminant QSOs and low-z galaxies, respectively. For our target redshift range (z ≳ 2.75), the algorithm correctly classifies most objects (∼90% completeness). The red dotted vertical line marks the minimum redshift targeted by the NB with the lowest wavelength (z = 2.7, NB455).
Current usage metrics show cumulative count of Article Views (full-text article views including HTML views, PDF and ePub downloads, according to the available data) and Abstracts Views on Vision4Press platform.
Data correspond to usage on the plateform after 2015. The current usage metrics is available 48-96 hours after online publication and is updated daily on week days.
Initial download of the metrics may take a while.