Fig. 16.
Download original image
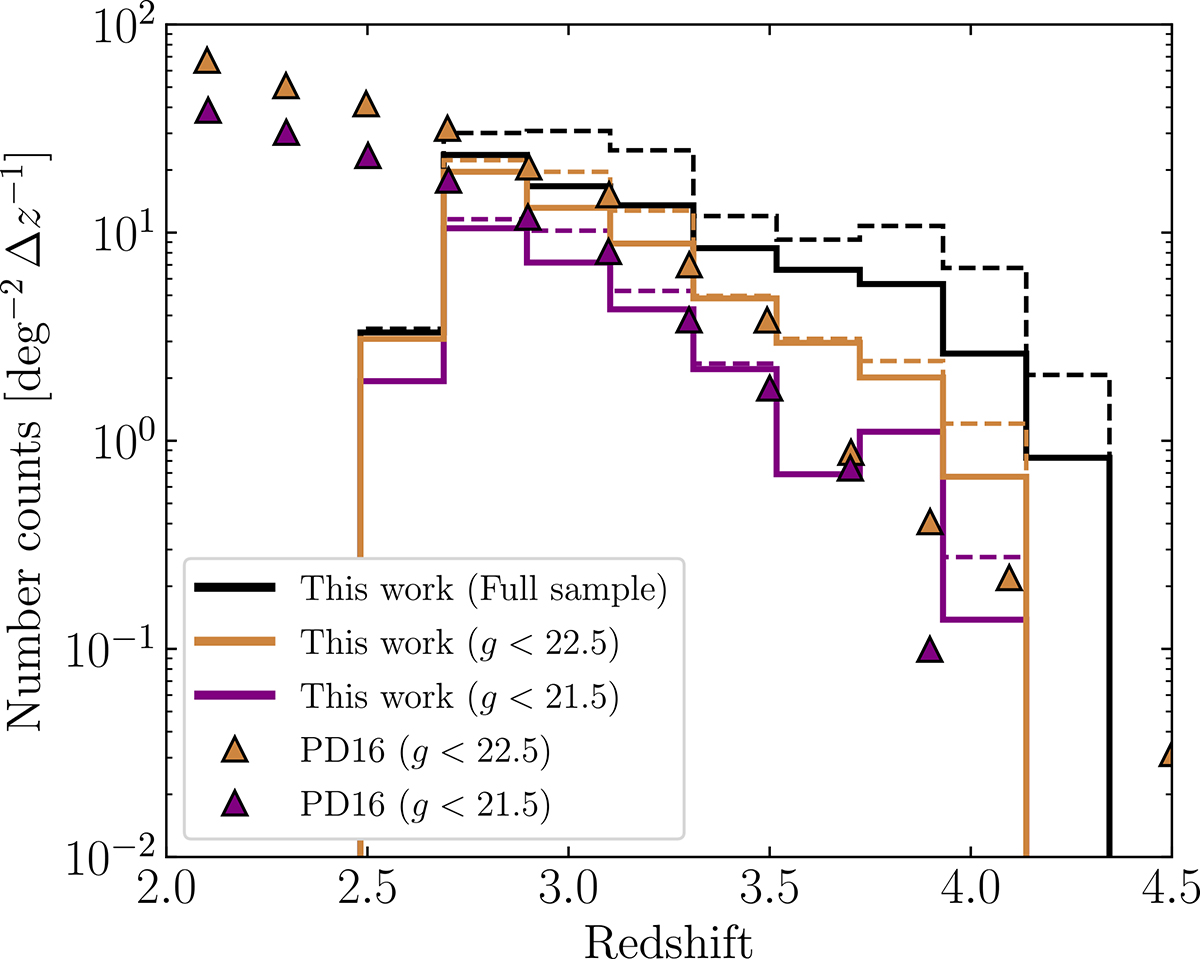
Differential number counts of QSOs per unit area of sky. The dashed histograms show our complete selected sample, the solid histograms show the distribution of our visually selected golden sample. We compare with the spectroscopic sample of Palanque-Delabrouille et al. (2016, PD16), selected through QSO variability. Our number counts are significantly higher than those of PD16, especially at the highest bins of redshift.
Current usage metrics show cumulative count of Article Views (full-text article views including HTML views, PDF and ePub downloads, according to the available data) and Abstracts Views on Vision4Press platform.
Data correspond to usage on the plateform after 2015. The current usage metrics is available 48-96 hours after online publication and is updated daily on week days.
Initial download of the metrics may take a while.