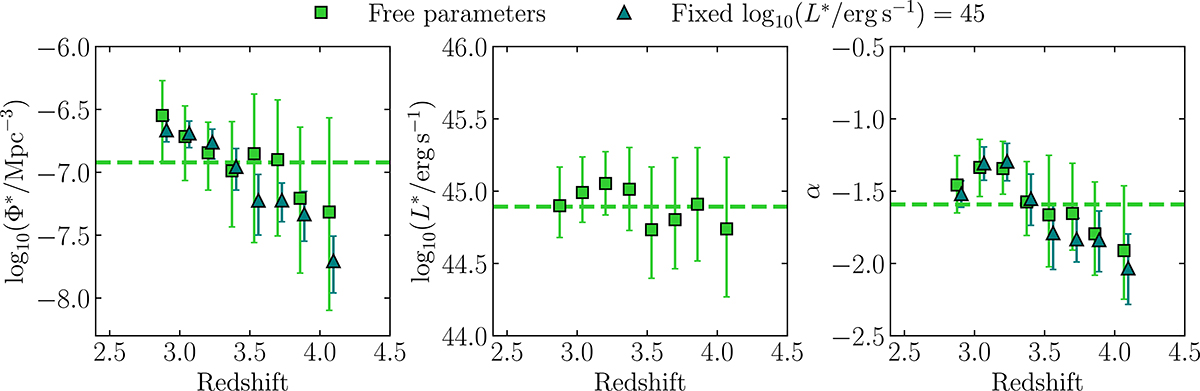
Fig. 15.
Download original image
Best-fit Schechter parameters for the LFs in the nine intervals of redshift. The horizontal dashed lines represent the average best-fit Schechter parameters across all redshifts. When leaving all three parameters free (green squares), the normalization Φ* and the characteristic luminosity L* show a slight decline within the intervals of confidence, whilst the faint-end slope α shows no clear trend. We also show the fitted parameters when fixing α and L* to the average values marked with the green dashed lines (blue triangles). The values of the latter are slightly shifted in the horizontal axis for visual clarity.
Current usage metrics show cumulative count of Article Views (full-text article views including HTML views, PDF and ePub downloads, according to the available data) and Abstracts Views on Vision4Press platform.
Data correspond to usage on the plateform after 2015. The current usage metrics is available 48-96 hours after online publication and is updated daily on week days.
Initial download of the metrics may take a while.