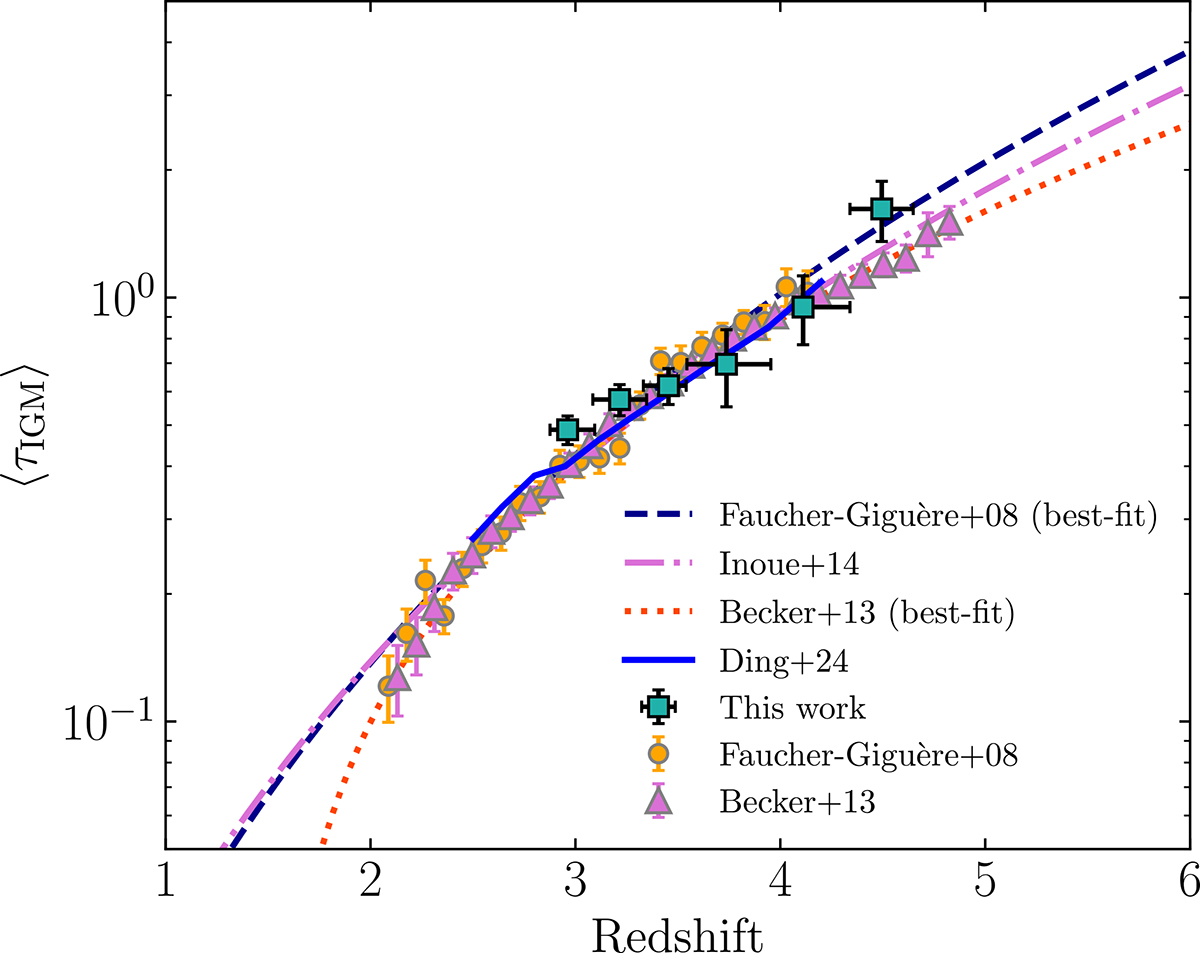
Fig. 14.
Download original image
Mean IGM transmission due to the Lyα forest. These estimations were obtained from the stacked composite spectra shown in Fig. 13. As comparison, we show the estimations in Becker et al. (2013), Inoue et al. (2014), Ding et al. (2024) and Faucher-Giguère et al. (2008), the latter employed as continuum correction in our selection method (see Sect. 3.2).
Current usage metrics show cumulative count of Article Views (full-text article views including HTML views, PDF and ePub downloads, according to the available data) and Abstracts Views on Vision4Press platform.
Data correspond to usage on the plateform after 2015. The current usage metrics is available 48-96 hours after online publication and is updated daily on week days.
Initial download of the metrics may take a while.