Fig. 13.

Download original image
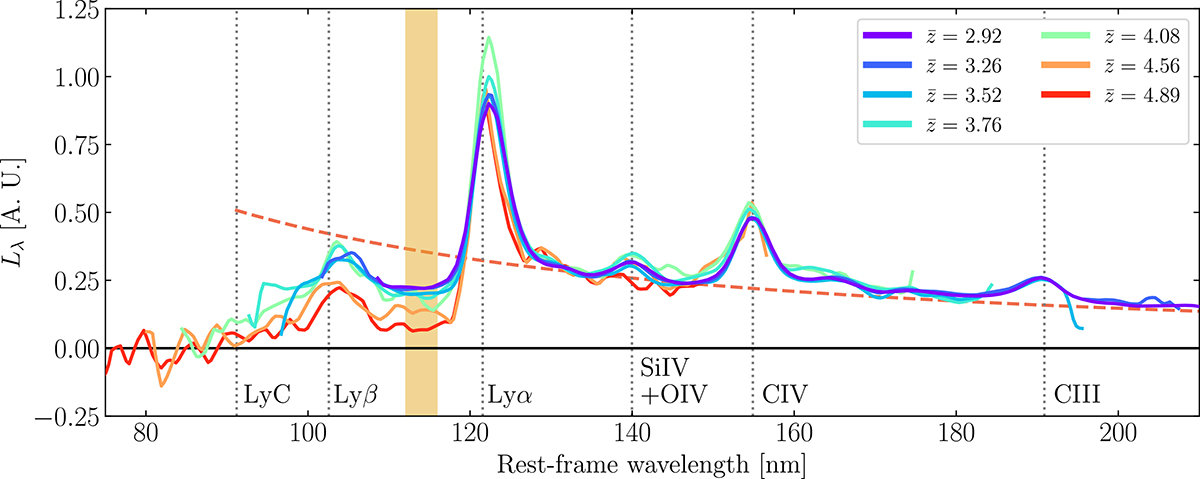
Composite QSO spectra in different bins of redshift. The composite spectra were obtained stacking the objects in our visually selected sample using the stonp code. The UV continuum slope show negligible evolution with redshift. The visible differences in the typical EW of the most prominent lines is likely due to intrinsically fainter sources dominating the lowest redshift bins, and the resolution increase in the rest-frame with redshift. The dotted vertical lines mark the rest-frame wavelengths of the most prominent QSO lines, and the Lyman limit (91.2 nm; LyC). The dashed pink line shows the best power-law fit for the UV continuum, with slope βUV = −1.55 ± 0.02. The shaded orange region is used to compute the average IGM optical depth (see Sect. 4.4).
Current usage metrics show cumulative count of Article Views (full-text article views including HTML views, PDF and ePub downloads, according to the available data) and Abstracts Views on Vision4Press platform.
Data correspond to usage on the plateform after 2015. The current usage metrics is available 48-96 hours after online publication and is updated daily on week days.
Initial download of the metrics may take a while.


