Fig. B.1.
Download original image
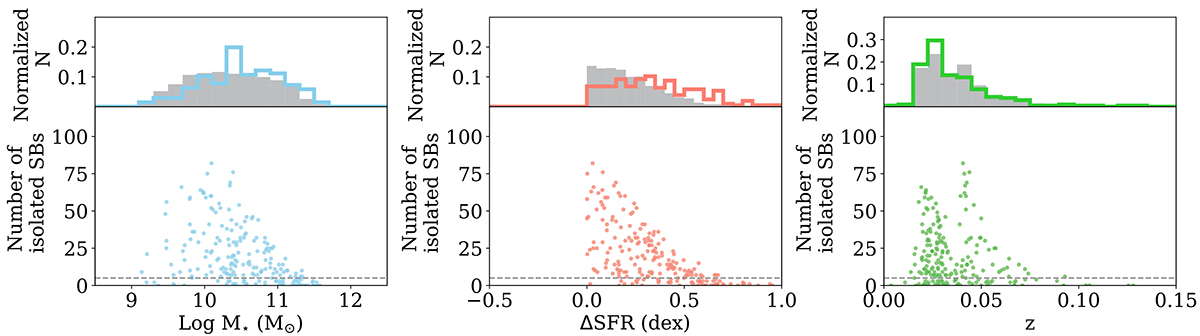
Top: Histograms of the normalized galaxy count for the isolated (solid) and post-merger (outline) SBs in terms of M⋆ (left), ΔSFR (middle), and z (right). Overall, the post-merger galaxies on average have slightly higher M⋆ and ΔSFR, appropriate for a scenario where mergers gain mass in an interaction and trigger a starburst. Bottom: The number of isolated SBs matched to each post-merger as a function of the post-merger’s M⋆ (left), ΔSFR (middle), and z (right). The minimum number of isolated SB controls required for our analysis (5) is marked with a gray dashed line. For all three matched variables, the number of matched isolated SBs decreases as the matched variable increases.
Current usage metrics show cumulative count of Article Views (full-text article views including HTML views, PDF and ePub downloads, according to the available data) and Abstracts Views on Vision4Press platform.
Data correspond to usage on the plateform after 2015. The current usage metrics is available 48-96 hours after online publication and is updated daily on week days.
Initial download of the metrics may take a while.