Open Access
Fig. 4.
Download original image
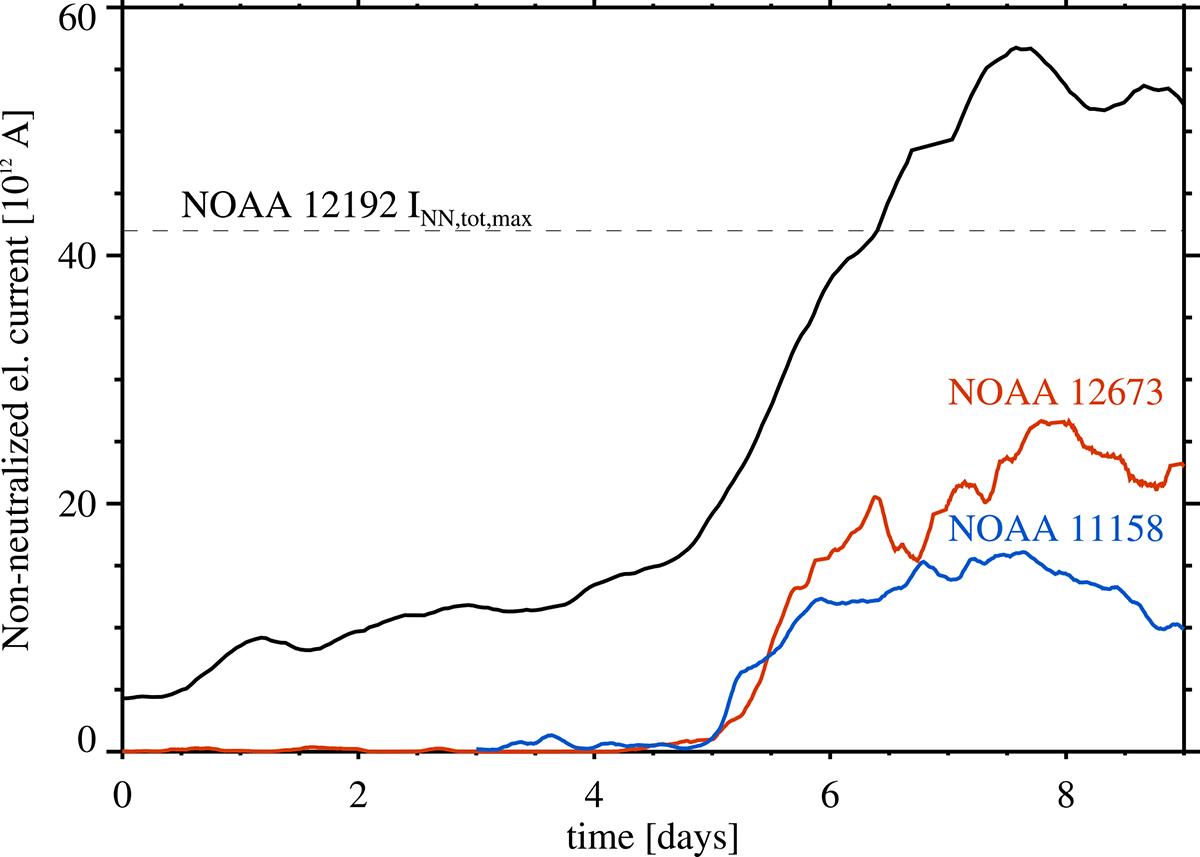
Time series of INN, tot of NOAA 11158 (blue) and NOAA 12673 (red) in comparison to NOAA 13664 (black). To facilitate comparison, the time series were shifted in time and the maximum INN, tot reached by NOAA 12192 is marked with the dashed, horizontal line.
Current usage metrics show cumulative count of Article Views (full-text article views including HTML views, PDF and ePub downloads, according to the available data) and Abstracts Views on Vision4Press platform.
Data correspond to usage on the plateform after 2015. The current usage metrics is available 48-96 hours after online publication and is updated daily on week days.
Initial download of the metrics may take a while.