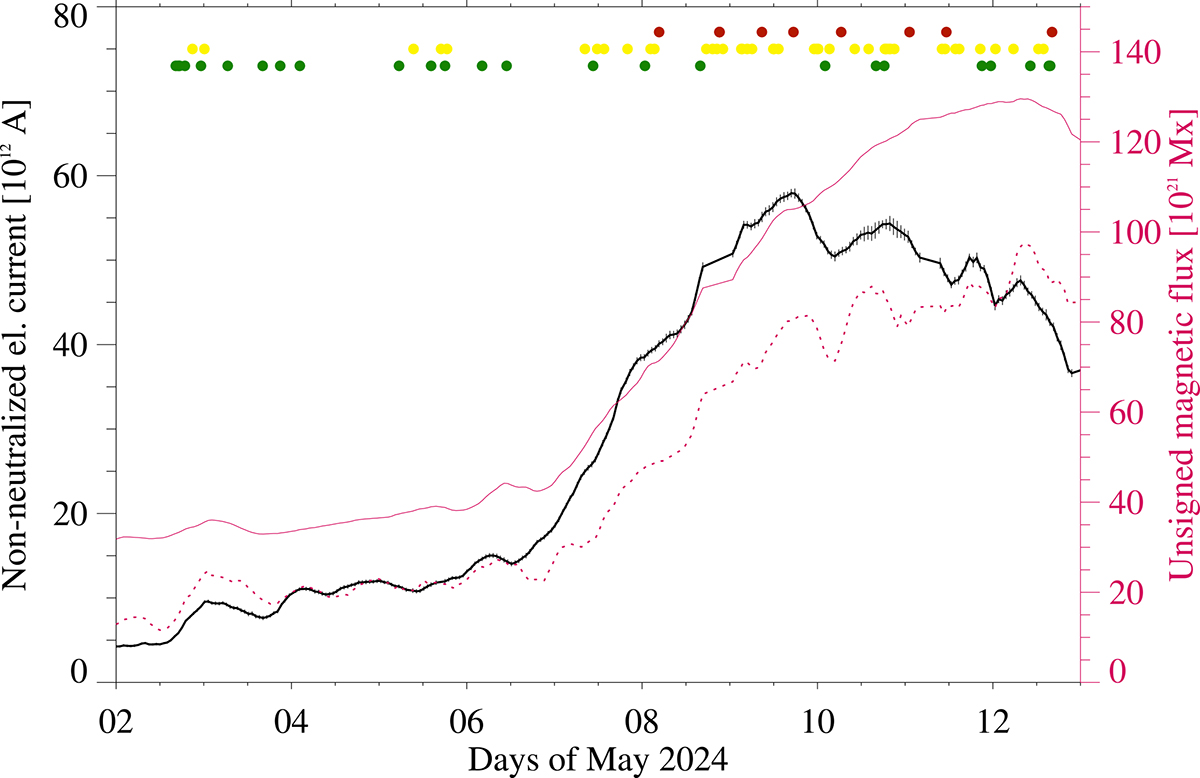
Fig. 3.
Download original image
Time series of the total unsigned non-neutralized electric currents, INN, tot (black). Overplotted are also the total unsigned magnetic flux Φ (solid pink) and the magnetic flux of the non-neutralized partitions ΦNN, tot (dotted pink). Green, yellow, and red dots indicate occurrences of C-, M-, and X-class flares, provided by NOAA SWPC. The time axis is in days, starting on 2 May 20224.
Current usage metrics show cumulative count of Article Views (full-text article views including HTML views, PDF and ePub downloads, according to the available data) and Abstracts Views on Vision4Press platform.
Data correspond to usage on the plateform after 2015. The current usage metrics is available 48-96 hours after online publication and is updated daily on week days.
Initial download of the metrics may take a while.