Fig. 2.
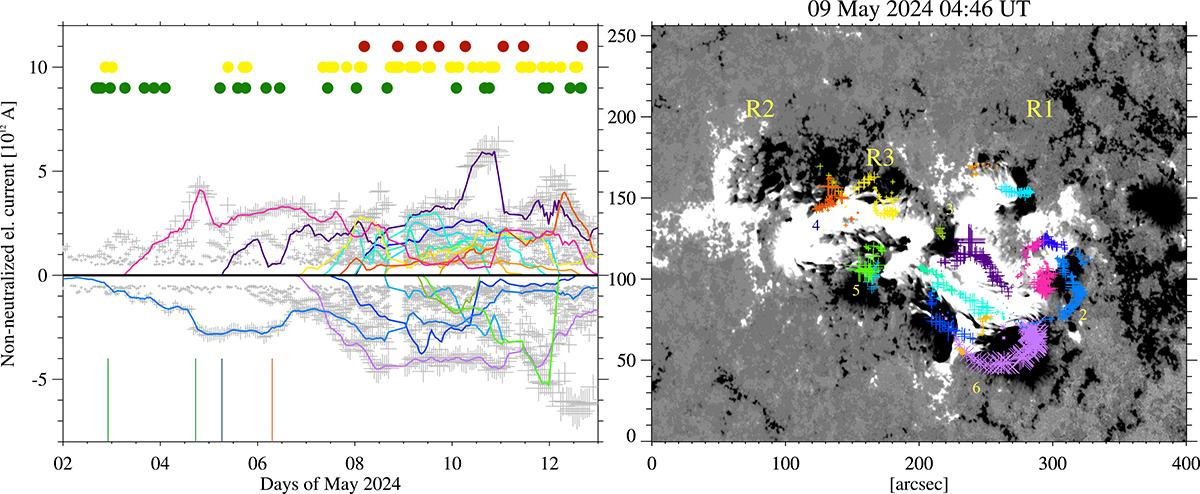
Download original image
Left: Electric currents INN carried by the non-neutralized partitions of the active region, as a function of time (gray crosses). The partitions that could be tracked over large parts of the time series are connected with colored solid lines. Only partitions with INN that exceed 0.5 ⋅ 1012 A were plotted, for clarity. Flaring activity is indicated as in Fig. 3. Vertical lines indicate the two emergence events of R2 (green), the emergence of R3 (blue), and the time of collision onset between the negative polarity of R3 with the positive of R1 (red). Right: Trajectories of the non-neutralized partitions plotted in the left panel, overplotted on a photospheric magnetogram of NOAA 13664. Different colors indicate correspondence with the curves in the left panel while larger plus signs indicate stronger absolute value of INN. The locations included in Fig. 1 are also provided here for reference.
Current usage metrics show cumulative count of Article Views (full-text article views including HTML views, PDF and ePub downloads, according to the available data) and Abstracts Views on Vision4Press platform.
Data correspond to usage on the plateform after 2015. The current usage metrics is available 48-96 hours after online publication and is updated daily on week days.
Initial download of the metrics may take a while.